State of the Network - April 2026
Welcome to the April edition. We track security, liquidity, volume, fees, user activity, and supply across THORChain.
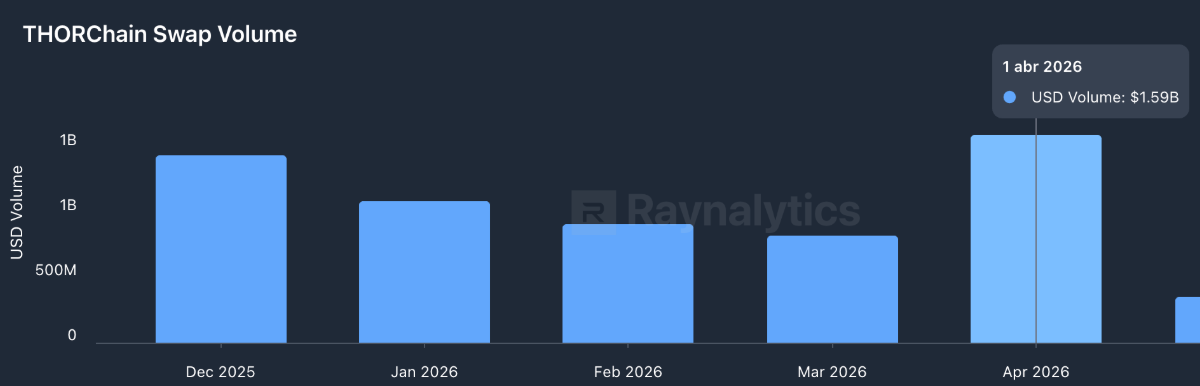
April snapped the streak. After two consecutive months of declining volume, March at $825M and February at $911M, the network logged $1.59B in April, the strongest monthly figure since December 2025. That's nearly double March in a single month.
v3.17.0 shipped on 28 April carrying over 100 improvements across security, swaps, and developer tooling. ADR26, the dynamic fee model, entered active node voting. The integration pipeline kept moving, with Zcash and Monero both closing in on mainnet.
Volume and Fees
General volume
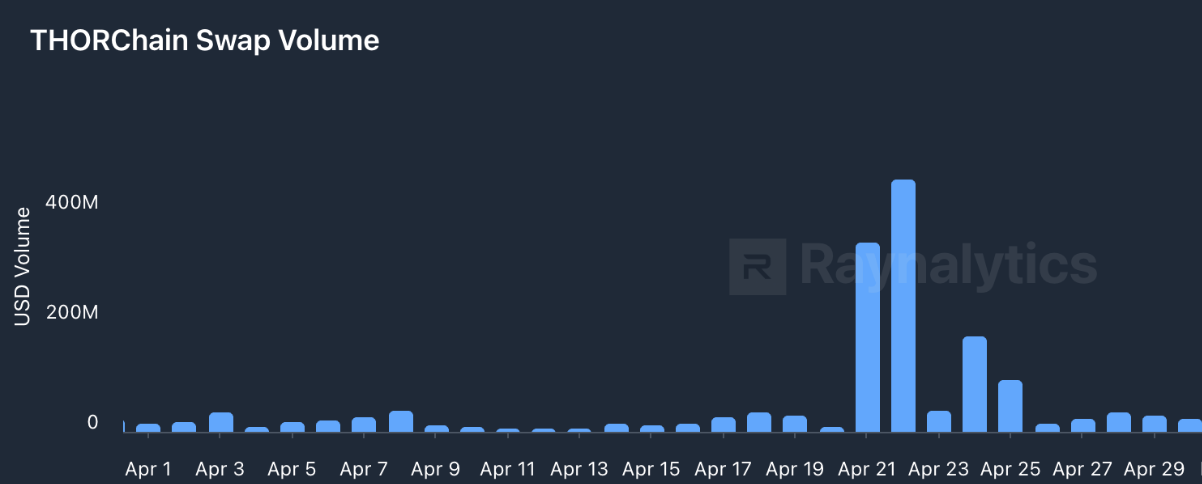
April's $1.59B didn't arrive evenly. For the first three weeks of the month, daily volume tracked in the $20M to $60M range, consistent with March's baseline.
That changed on April 21st. Volume surged to around $310M, then peaked at $459M on the 22nd, the highest single-day figure THORChain had recorded in months. Those two days alone account for roughly half the month's total. A cluster of elevated sessions followed through the 25th before the network settled back to baseline.
The spike was driven by significant cross-chain flow following a major DeFi security incident in the broader ecosystem. THORChain processed every transaction on-chain, transparently, without censoring.
Swap Paths
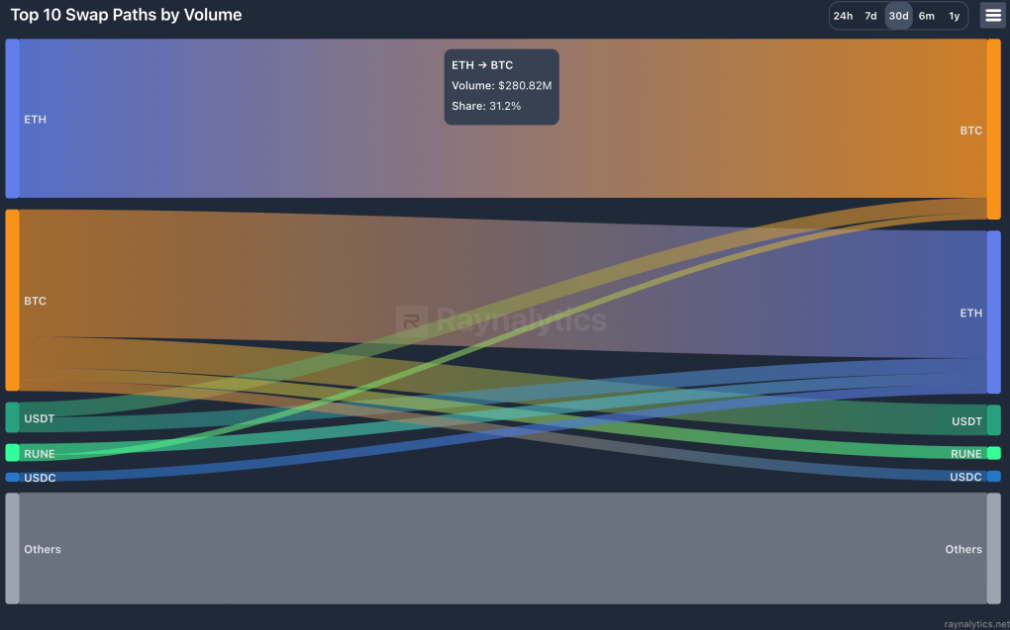
The top swap paths chart shows one notable shift from March: ETH to BTC was the dominant route in April, accounting for $280.82M in volume and 31.2% of the top 10 paths. March had the reverse, with BTC to ETH leading. That flip lines up directly with the spike period, where the primary flow was ETH being converted into Bitcoin.
BTC to ETH held the second spot, with USDT, RUNE, and USDC rounding out the visible routes. The BTC/ ETH pair in both directions continues to define THORChain's volume profile, which hasn't changed.
Fees collected
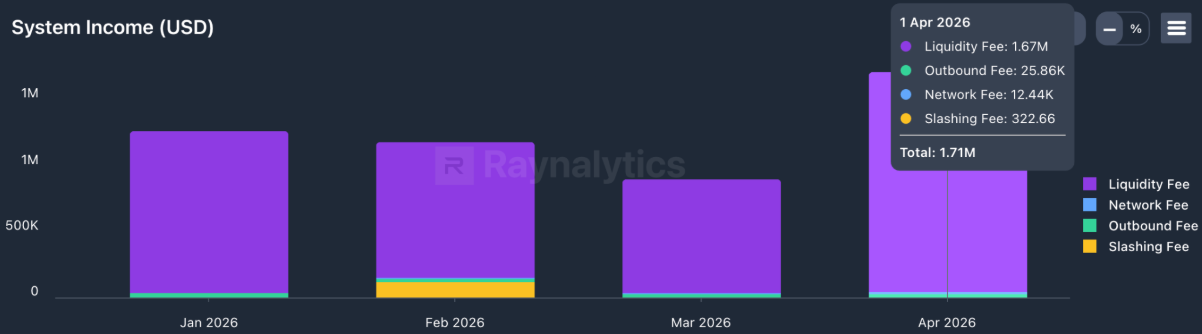
April generated $1.71M in total system income, the highest monthly figure since January and a significant jump from March's ~$800K. Liquidity fees drove virtually all of it at $1.67M, with outbound fees adding $25.86K, network fees $12.44K, and slashing fees a negligible $322.
TCY and RUNE Yield
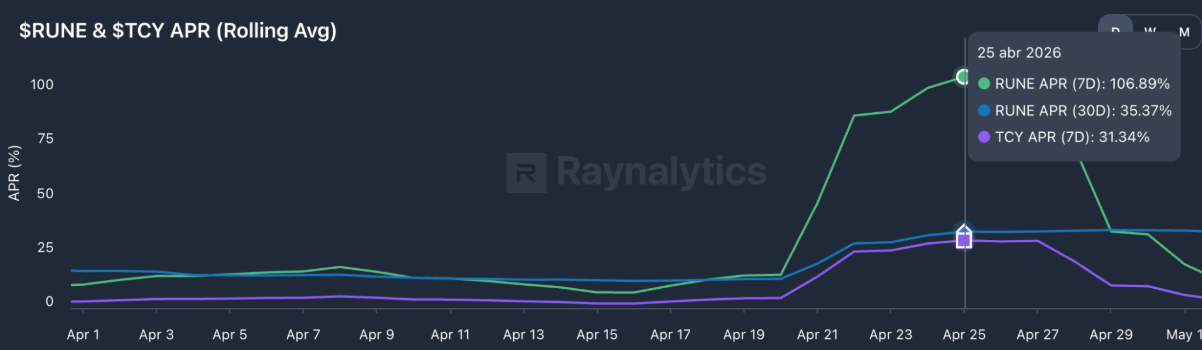
The fee spike translated directly into yield. The 7-day rolling RUNE APR hit 106.89% at its peak on April 25th, briefly crossing the 100% threshold as the high-volume days fed through the distribution model. The 30-day rolling figure settled at 35.37%, a more grounded read of what the month delivered on average. TCY's 7-day APR reached 31.34% at the same peak point.
Retention and User Acquisition
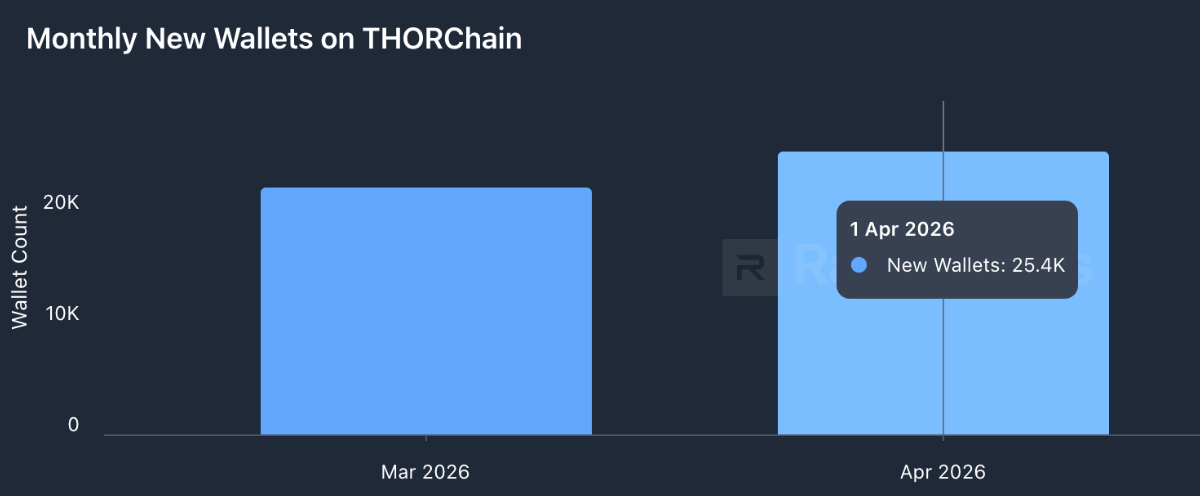
April added 25.4K new wallets, up from approximately 21K in March. That's a meaningful increase and worth noting because wallet creation isn't directly tied to the volume spike the way fees and yield are. New wallets reflect genuine first-time interaction with the protocol, and that number moved in the right direction regardless of what drove the trading activity.
Security and Supply
Bonds
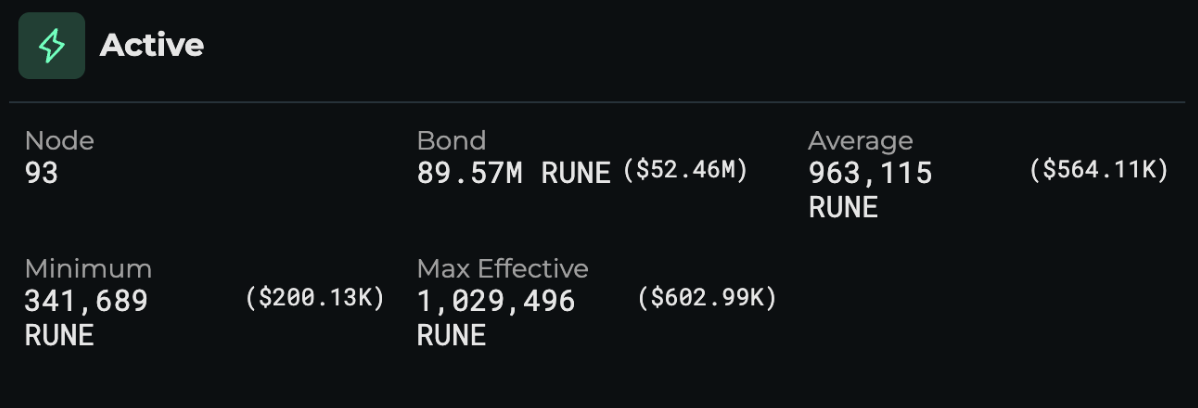
April closed with 93 active nodes, down from 105 in March. Total bonded capital sits at 89.57M RUNE ($52.46M), with an average bond of 963,115 RUNE ($564.11K) per node. The minimum bond stands at 341,689 RUNE ($200.13K) and the maximum effective cap at 1,029,496 RUNE ($602.99K).Despite fewer active nodes, the USD value of total bond actually increased from $39.22M in March to $52.46M in April, reflecting RUNE's price appreciation during the month. Average bond per node also rose meaningfully, from $373.56K to $564.11K. The network held fewer operators but each carried more economic weight.
Supply
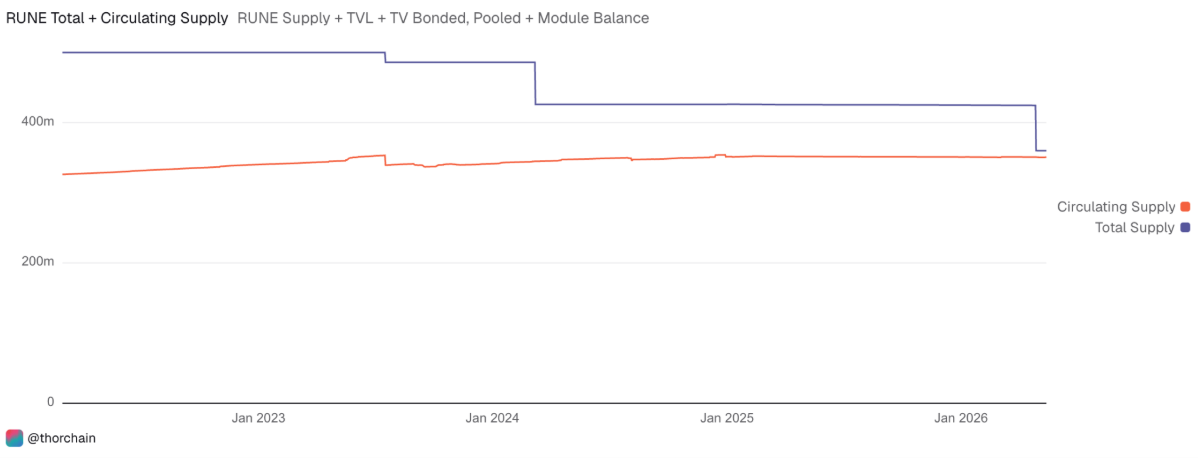
The most significant supply event of April is visible in the chart: the reserve line dropped sharply around April 27th, falling from roughly 74M RUNE down to 9.3M. That's the 64M+ RUNE reserve burn shipping with v3.17.0, permanently removing that capital from the protocol's reserve. Total supply now sits just over 360M RUNE, marginally above the target due to a small rounding discrepancy that the burn mechanism will close on its own.
The other lines held relatively stable through the month. Bonded RUNE stayed around 95M, pooled supply drifted slightly lower, CEX holdings ticked up modestly, and RUNE held in wallets continued its gradual climb. Nothing dramatic outside of the reserve event.
Burn
The 30-day burn chart mirrors the volume story precisely. The spike around April 22nd to 25th produced the most concentrated burn activity of the period, a direct consequence of the fee surge flowing through the 5% burn mechanism. Outside of that window, the burn rate ran flat and minimal.
Total RUNE burned over 30 days: $113,063.67 in USD terms. Cumulative all-time burned value now stands at $81,941,984.79, approaching the $82M mark. Combined with the 64M+ RUNE reserve burn covered in the supply section, April was a meaningful month for supply reduction from both directions: the ongoing fee burn and the one-time structural burn that permanently reshaped the reserve.
Frontends
Leaderboard by Volume
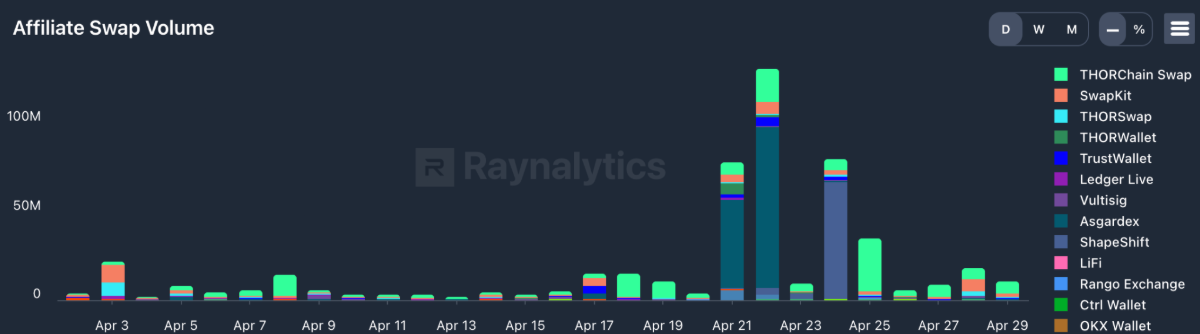
The affiliate chart follows the same shape as the broader volume picture, with the spike window around April 21st to 25th towering over the rest of the month. What's interesting is which interfaces captured that flow.
Asgardex led the affiliate volume for the month, taking the largest share during the peak days. ShapeShift also saw a notable surge during the same window, well above its typical baseline. THORChain’s frontend (swap.thorchain.org) remained consistently present throughout the month, including during the quieter periods where most other affiliates barely registered. SwapKit, THORSwap and TrustWallet contributed across the month in smaller but steady amounts.
The spike days effectively stress-tested the affiliate layer. Multiple interfaces processed meaningful volume simultaneously, which is a healthier distribution than volume concentrating in a single frontend.
Rapid swaps
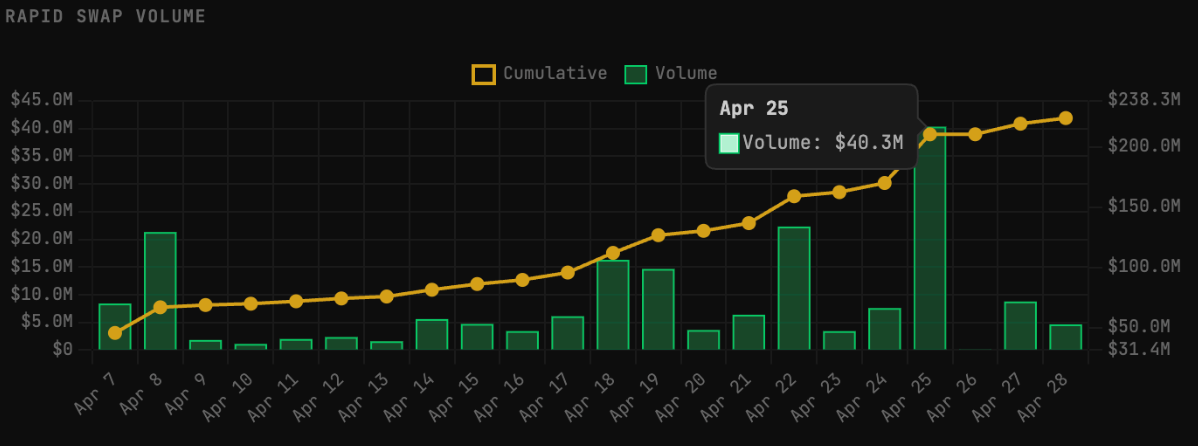
Rapid Swaps continued building volume through April, with the chart running from April 7th through the 28th. Cumulative volume reached $238.3M over that window, with daily figures ranging from under $1M on quieter days up to around $38M on April 25th. The cumulative line climbs consistently throughout the month with no sign of plateau.
The spike days in the second half of April contributed meaningfully to the total, but even outside of that window the feature was processing steady daily volume. The trajectory is encouraging.
Key Takeaways
April was defined by contrast. Three quiet weeks followed by a few days that generated more volume and fees than most full months. The organic baseline held steady, the reserve burn permanently reshaped the supply picture, and the integration pipeline kept advancing regardless of what the market was doing.
If there are specific metrics or themes you want included in future editions, drop your requests in the comments. We'll add the most relevant ones next month.
Data Sources: THORChain Explorer, Raynalitics, Dune, BooneTools

Related articles
![THORChain Exploit Report #2 Thumbnail]()
Jul. 3, 2026
THORChain Exploit Report #2
- Report
![]()
Jul. 1, 2026
State of the Network - June
- Report
![THORChain v3.19.0 protocol upgrade article thumbnail covering Monero support, affiliate revenue share, DASH InstantSend and the TSS security patches behind the network restart.]()
Jun. 9, 2026
Protocol Upgrade - V3.19.0
- Report
![]()
Jun. 1, 2026
State of the Network - May
- Report
![]()
Oct. 21, 2022
THORChain Ecosystem Update
- Report
![]()
Dec. 21, 2021
Dev Update #120-#121
- Report
![]()
Feb. 8, 2021
THORChain Multichain Testnet Live
- Report
![]()
May. 7, 2020
Update on Operational Reserve
- Report