State of the Network - May 2026
Welcome to the May edition. THORChain ran for 15 days before a security incident on May 15th brought the network to a controlled halt. It remains paused as this report is written.
The first two weeks were genuinely positive. Volume was building, the integration pipeline was advancing, and the protocol had just shipped v3.17 with the 64M $RUNE reserve burn and a 2 basis point fee tier for stable-to-stable swaps. The mood heading into mid-May was constructive.
On May 15th, a targeted exploit drained approximately $10M from a single Asgard vault. The attacker had churned into the active node set two days earlier, participated in routine signing ceremonies, and progressively reconstructed the vault's private key through a vulnerability in THORChain's GG20 Threshold Signature Scheme (TSS). The five remaining vaults were unaffected. The network's automatic solvency detection triggered within minutes, and nodes coordinated a full controlled halt within roughly two hours.
The response was fast and organised. v3.18.1 shipped with a patch, ADR028 (the governance framework covering fund recovery) was approved by nodes, and the TSS library was temporarily moved to closed source while Soda Labs completed a full cryptographic audit. That audit confirmed that the attack required cryptographer-grade expertise, not just familiarity with the codebase.
Volume and Fees
General volume
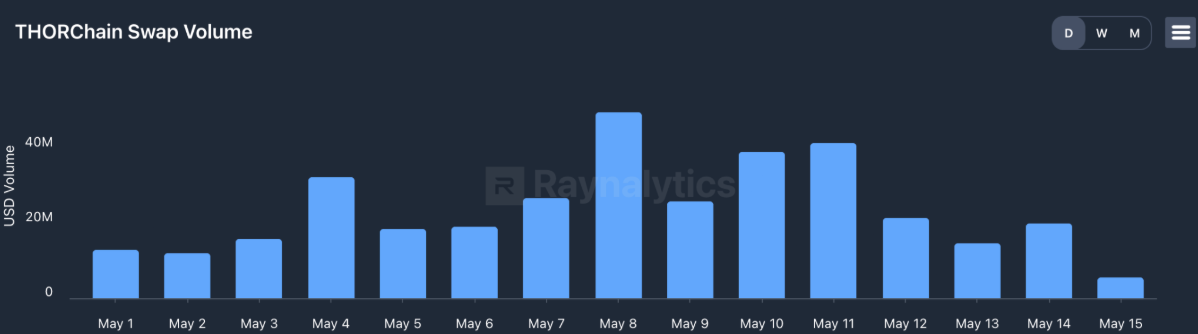
Those 15 days processed $355M in total swap volume. For context, April closed at $1.59B across a full month. May's first 15 days volume opened around $10M to $15M before stepping up meaningfully from May 4th onward. May 8th peaked at around $47M, with May 10th and 11th both approaching $40M.
Fees collected
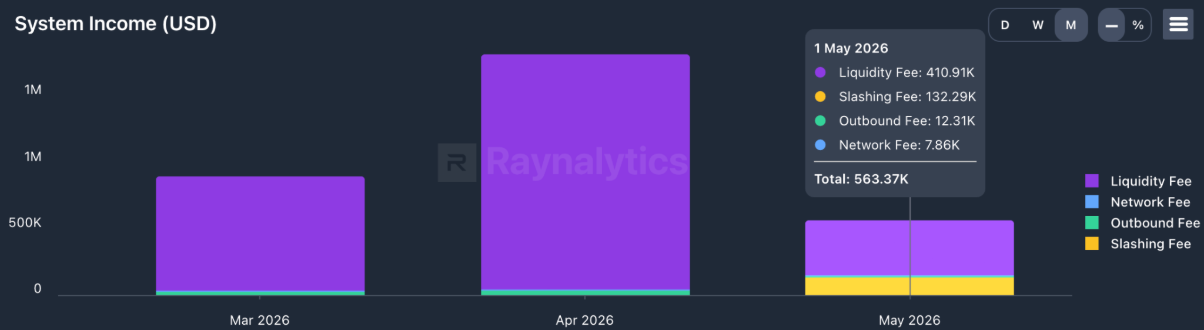
May generated $563.37K in total system income across its 15 active days. Liquidity fees accounted for $410.91K of that, with slashing fees contributing a notably higher share than usual at $132.29K. Outbound fees added $12.31K and network fees $7.86K.
TCY and RUNE Yield
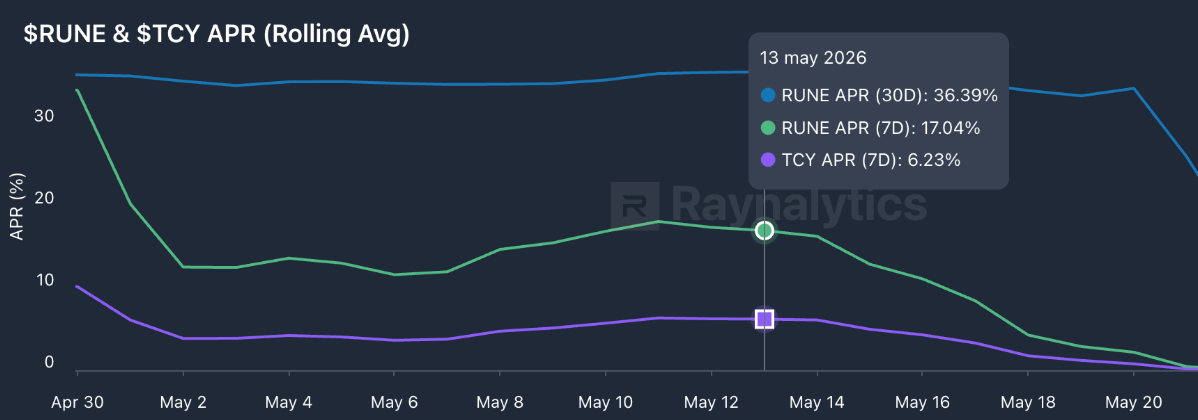
The rolling APR chart tells the story of the halt clearly. Through the first two weeks of May, both metrics were stable and respectable. The 7-day $RUNE APR held in the 10% to 17% range, gradually climbing as volume improved. $TCY sat lower but steady, tracking between 2% and 6%. The 30-day $RUNE APR opened around 35%, still absorbing April's strong fee days in the rolling window, and held that level all the way through to around May 20th.
Then the lines drop. After May 15th, with no swap activity generating fees, the 7-day figures collapsed toward zero. The 30-day figure followed more slowly, as it takes longer for the paused days to drag down a wider rolling window.
Retention and User Acquisition
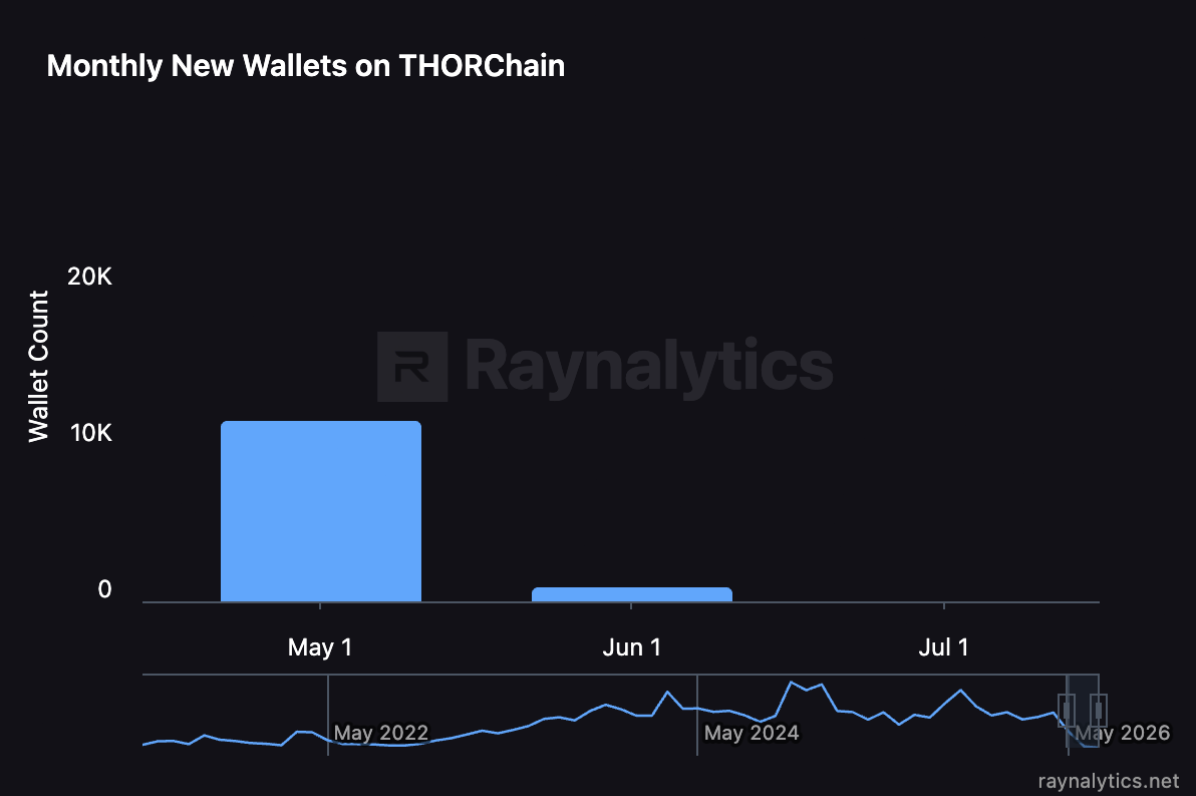
May added approximately 10K new wallets across its 15 active days, compared to April's 25.4K across a full month. Prorated, that's a broadly comparable acquisition rate.
Security and Supply
Bonds
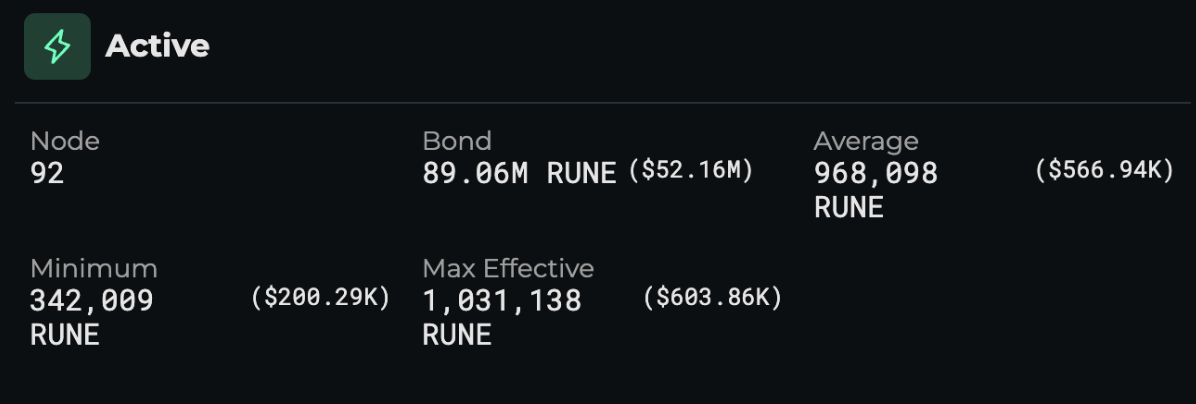
May closed with 92 active nodes, down one from April's 93. Total bonded capital sits at 89.06M $RUNE ($52.16M), with an average bond of 968,098 $RUNE ($566.94K) per node. The minimum bond stands at 342,009 $RUNE ($200.29K) and the maximum effective cap at 1,031,138 $RUNE ($603.86K). Figures are broadly stable compared to April, with no meaningful shift in the overall bond picture.
What did change is how the protocol handled the attacker's node. The malicious operator's bond was slashed in full. Innocent nodes that happened to share the same vault as the attacker are protected and won't face penalties. The recovered $RUNE from the slash is paired with whatever assets can be recovered from the affected vault, with any surplus $RUNE burned.
Burn
The 30-day burn chart follows the volume curve precisely. Activity built through the first two weeks, peaking around May 10th to 13th as daily volume hit its highest levels, then drops sharply after May 15th and flatlines. No swaps, no fees, no burn.
The 30-day burn total came in at $19,467.52, a significant step down from April's $113,063.67, reflecting both the shorter active window and the lower overall volume. Cumulative all-time burned value sits at $81,928,673.78, just shy of the $82M mark reached briefly at end of April before the figure adjusted with $RUNE price movement.
Frontends
Leaderboard by Volume
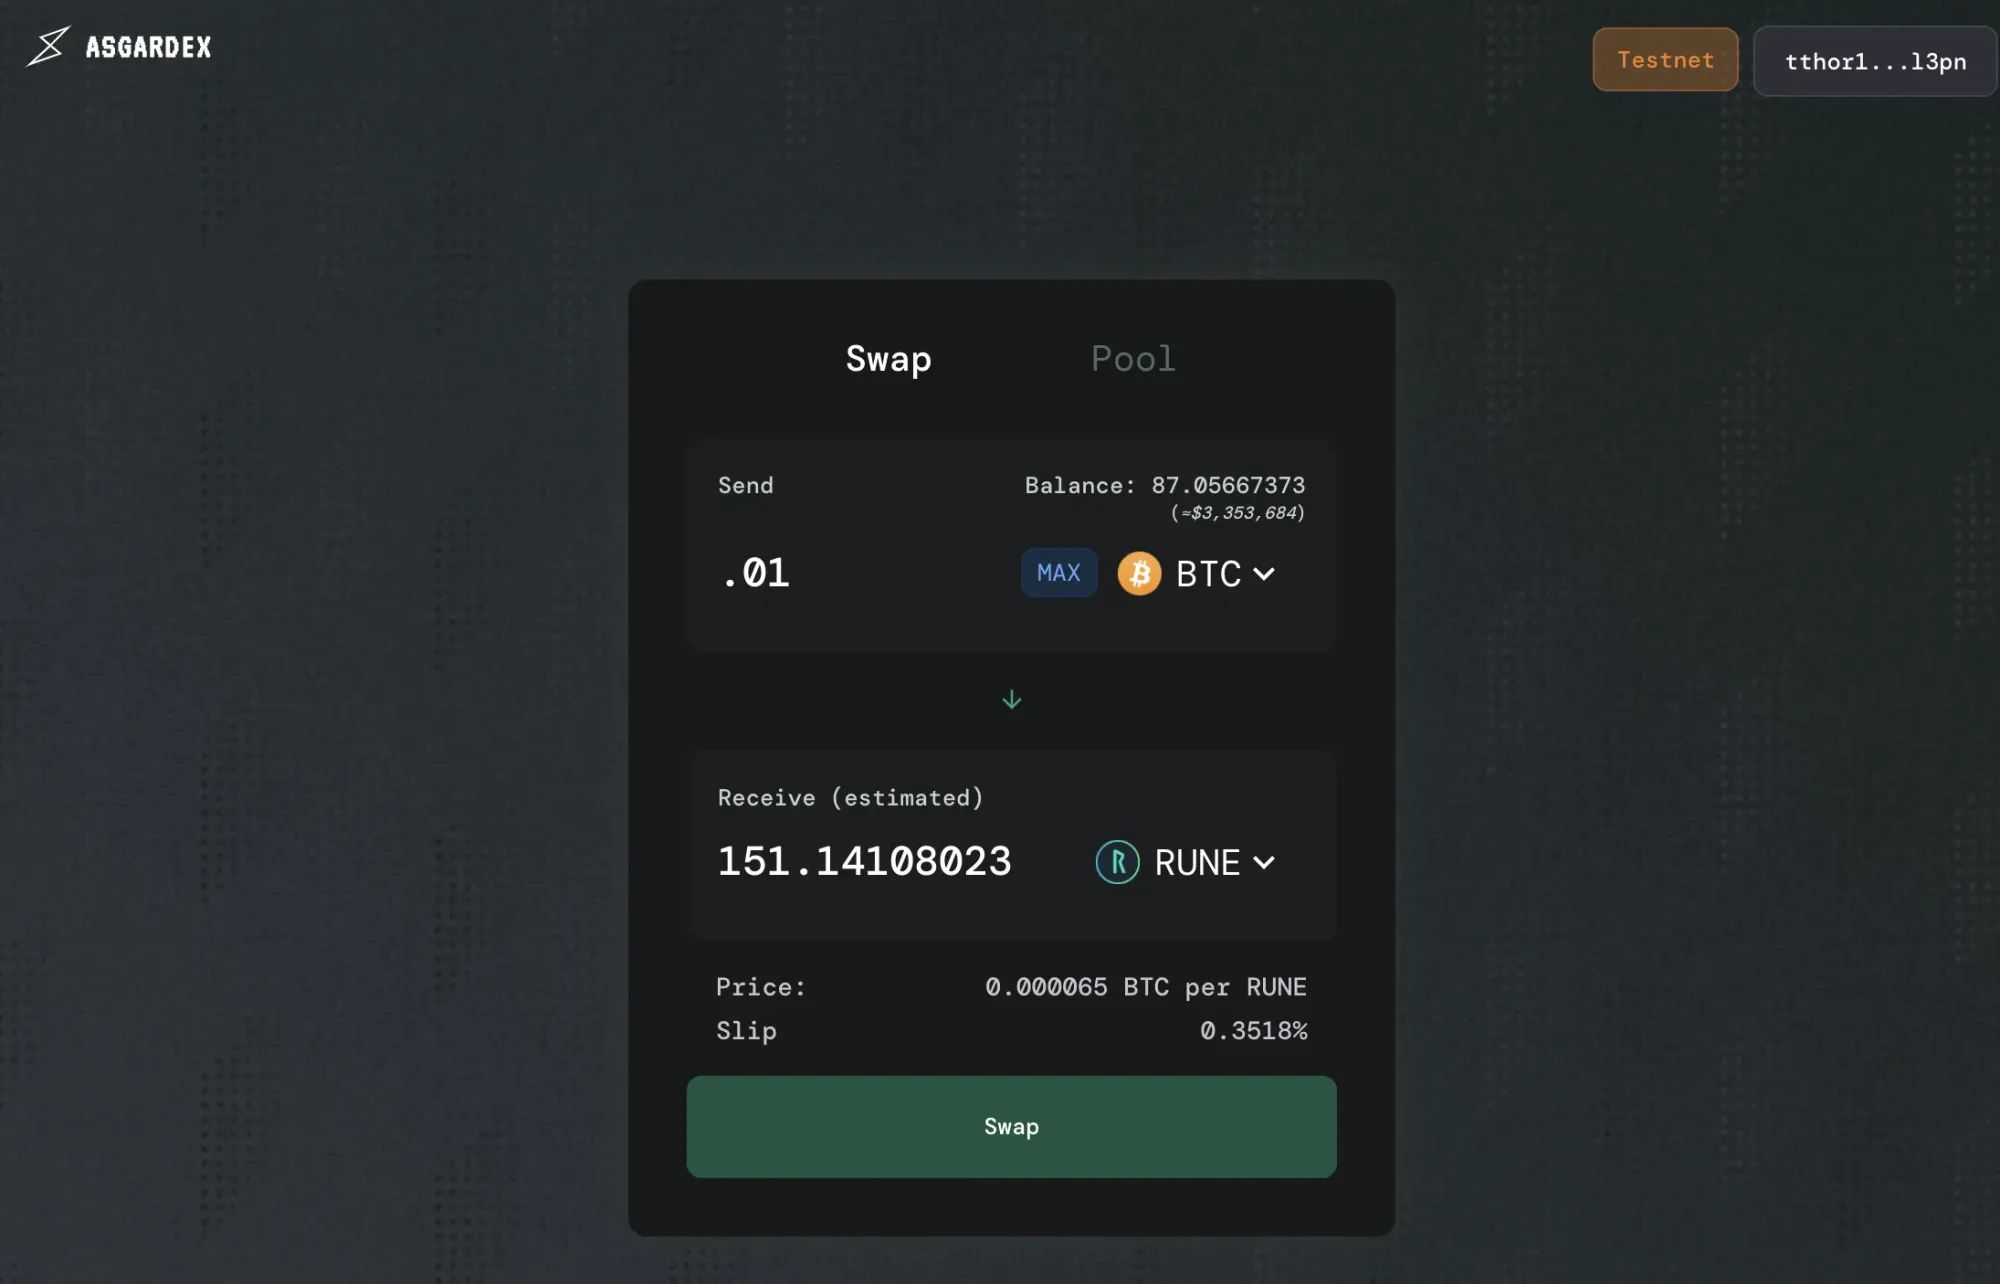
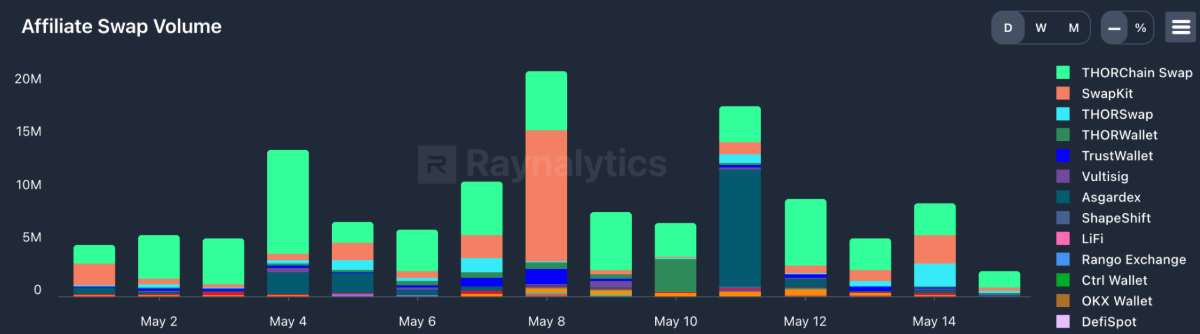
THORChain Swap (swap.thorchain.org) led the affiliate leaderboard across May's 15 active days with $62.54M in volume, more than double SwapKit in second place at $27.10M. Asgardex came in third at $17.92M, followed by THORSwap at $7.25M and THORWallet at $5.92M. TrustWallet, NativeSwap, Vultisig, Edge Wallet, Rujira, and SafePal rounded out the rest of the board.
Key Takeaways
May was half a month. The 15 days the network ran processed $355M in volume, generated $563K in fees, added 10K new wallets, and saw swap.thorchain.org lead the affiliate board with $62.54M.
The incident on May 15th brought everything to a stop. The response was coordinated, the recovery framework is in place, and v3.19 is the restart release.
If there are specific metrics or themes you want included in future editions, drop your requests in the comments. We'll add the most relevant ones next month.
Data Sources: THORChain Explorer, Raynalitics, Dune, BooneTools

Related articles
![THORChain Exploit Report #2 Thumbnail]()
Jul. 3, 2026
THORChain Exploit Report #2
- Report
![]()
Jul. 1, 2026
State of the Network - June
- Report
![THORChain v3.19.0 protocol upgrade article thumbnail covering Monero support, affiliate revenue share, DASH InstantSend and the TSS security patches behind the network restart.]()
Jun. 9, 2026
Protocol Upgrade - V3.19.0
- Report
![THORChain's State of the Network: April 2026]()
May. 1, 2026
State of the Network - April
- Report
![]()
Oct. 21, 2022
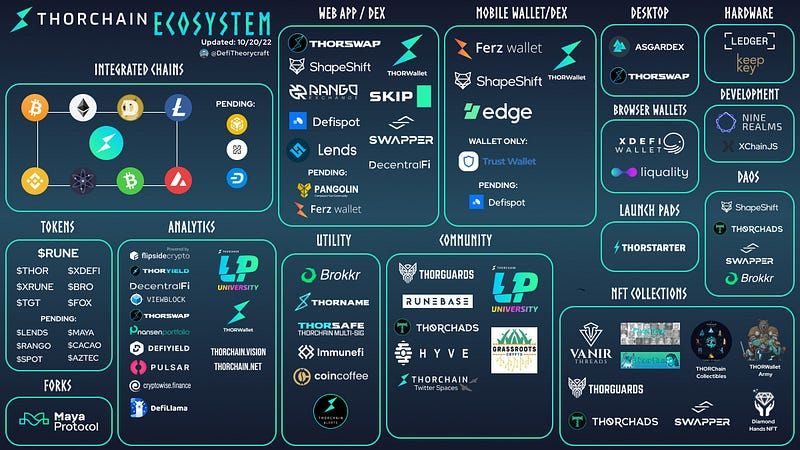
THORChain Ecosystem Update
- Report
![]()
Dec. 21, 2021
Dev Update #120-#121
- Report
![]()
Feb. 8, 2021
THORChain Multichain Testnet Live
- Report
![]()
May. 7, 2020
Update on Operational Reserve
- Report