This report covers three months of Dev & Ops Fund spending, income, and protocol performance, from July to September 2026. It is prepared by the THORChain Coordination Group. Live operations status is published at devops.thorchain.org .
This article is based on the Coordination Group's Q3 report. The full report, with its charts, is available online.
Q3 at a glance | Value |
|---|---|
Period | July to September 2026 |
Dev & Ops Fund spend | USD 684,238 |
Self-funded | USD 154,828 |
Monthly spend | USD 260k to 203k |
Where the Money Went
Category | July 2026 | August 2026 | September 2026 | Total | % of total |
|---|---|---|---|---|---|
Development | 63,969 | 95,910 | 45,410 | 205,289 | 24.7% |
Operations - Security | 55,000 | 50,000 | 50,000 | 155,000 | 18.8% |
Infrastructure - RPC* | 26,000 | 10,000 | 42,000 | 78,000 | 9.5% |
Operations - STO (Swap Frontend) | 20,000 | 20,000 | 20,000 | 60,000 | 7.3% |
Infrastructure - Explorers* | 20,000 | 20,000 | 20,000 | 60,000 | 7.3% |
Development - Audit | 40,000 | - | - | 40,000 | 4.9% |
Operations - Biz Dev | 14,637 | 11,666 | 11,666 | 37,969 | 4.6% |
Infrastructure - Analytics | 8,400 | 8,400 | 8,400 | 25,200 | 3.1% |
Operations - Admin | 3,000 | 3,000 | 3,000 | 9,000 | 1.1% |
Operations - Mod & Support | 2,600 | 1,000 | 1,800 | 5,400 | 0.7% |
Operations - Legal (IP name) | 5,000 | - | - | 5,000 | 0.6% |
Operations - Documentation | 1,380 | 1,000 | 1,000 | 3,380 | 0.4% |
Total - Dev & Ops Fund | 259,986 | 220,976 | 203,276 | 684,238 | 83.0% |
Dev & Ops Fund income | 44,124 | 66,262 | 44,442 | 154,828 | 22.6% |
Paid by Treasury - Dev & Ops Fund shortfall | 215,862 | 154,714 | 158,834 | 529,410 | 77.4% |
One-off - ThorFi legal counsel (outside the Dev & Ops Fund) | 140,000 | - | - | 140,000 | 17.0% |
Grand total - Dev & Ops Fund + one-off | 399,986 | 220,976 | 203,276 | 824,238 | 100.0% |
* Partially paid in sponsored nodes, not cash-flow relevant. All figures in USD. Includes unpaid and open invoices. The ThorFi legal counsel expense was funded by the Treasury, outside the Dev & Ops Fund. Income and Treasury shares are percentages of Dev & Ops Fund spend.
A Lean Operating Model
Monthly Dev & Ops Fund spend fell 22%, from USD 260k in July to USD 203k in September, with no reduction in scope. The Coordination Group continues to operate in a lean and efficient model.
Every line item is budgeted, invoiced, and reported. Nothing recurring runs without an owner and a cap.
Funding the Shortfall
Dev & Ops Fund income was USD 154,828 in Q3, 22.6% of spend, from 5% of protocol revenue. The Treasury covered the remaining USD 529,410, or 77.4% of spend.
Month | Income | Spend | Covered by income |
|---|---|---|---|
July | 44,124 | 259,986 | 17.0% |
August | 66,262 | 220,976 | 30.0% |
September | 44,442 | 203,276 | 21.9% |
Q3 | 154,828 | 684,238 | 22.6% |
Treasury Action on Revenue
The Treasury has taken steps to increase its own revenue and reduce reliance on asset sales.
- Staking available assets, such as TCY, to generate yield on holdings that would otherwise sit idle.
- Shortfall funding continues from the Treasury while protocol income is grown.
- The aim remains for the Dev & Ops Fund to carry more of its own cost each quarter.
Dev & Ops Fund income is 5% of protocol revenue. Spend includes roughly USD 30k per month settled in sponsored nodes.
What Happened in Q3
- Lean operating model maintained. Monthly spend fell from USD 260k to USD 203k across the quarter, with no reduction in scope.
- Development remains the largest line. USD 205k, 24.7% of spend. Contributors are scoped, budgeted, and accountable.
- Security audit funded. A USD 40k audit was completed in July. Security operations held steady at USD 50k to 55k per month.
- Treasury revenue action. Available assets such as TCY are now staked to generate yield for the Treasury.
Q3 Protocol Performance
Metric | Q3 2026 | Context |
|---|---|---|
Swap volume | USD 2.41B | USD 28.0M per day, up from 22.7M per day in Q2 |
Liquidity fees | USD 2.64M | Up 18% per day against Q2 |
Partner-routed volume | USD 512M | Up 34% from Q2, 40 new affiliate tags on the network |
Interfaces routing 1M+ | 16 to 20 | 119 partner conversations tracked, 20 in advanced talks |
Partner channel | Q3 volume | vs Q2 | Note |
|---|---|---|---|
THORChain Swap | USD 258.0M | +95% | Houdini Swap private-swap option live September 23 |
SwapKit | USD 94.5M | +103% | Revenue share live October 14 (ADR-029) |
Two wallet integrators | USD 45.1M | +152% | |
Q4 to date (October 1 to 14) | USD 592M | 42.3M per day | Six new partner conversations |
Source: THORChain BD report, Q3 2026. Figures cover July 1 to September 24. September 25 to 30 is excluded (exploit-linked flows, see the September State of the Network). The Q2 baseline is low due to the post-exploit halt.
What THORChain Delivered in Q3
Native Zcash Shipped
ZEC integration was built and tested through Q3 (v3.16 to v3.20). The pool went live on October 2 and native swaps on October 8. No wrapped tokens.
Rev Share Launched (ADR-029)
Interfaces earn from THORChain's fee instead of stacking their own. Early result: 3.8x profit and 2000x volume on the routed flow. The SwapKit deal went live on October 14.
RUNE Bond Grew
Bond demand rose through the quarter and the validator set expanded. Bonded RUNE continued to climb into October.
Dynamic Fee Pilot (ADR-026)
THORChain captured about 34% of ShapeShift's routed volume in July. Edge Wallet and Symbiosis joined the pilot on September 26.
Monero and Houdini
The XMR integration was audited (USD 40k, July) and released alongside Zcash. Houdini Swap adds a private-swap option and a treasury fee share.
AI Agent Route
A public MCP server gives AI agents 126 tools, including swap quotes. 30 agent platforms have been mapped, and outreach to the first five is under way.
DevOps Dashboard Live
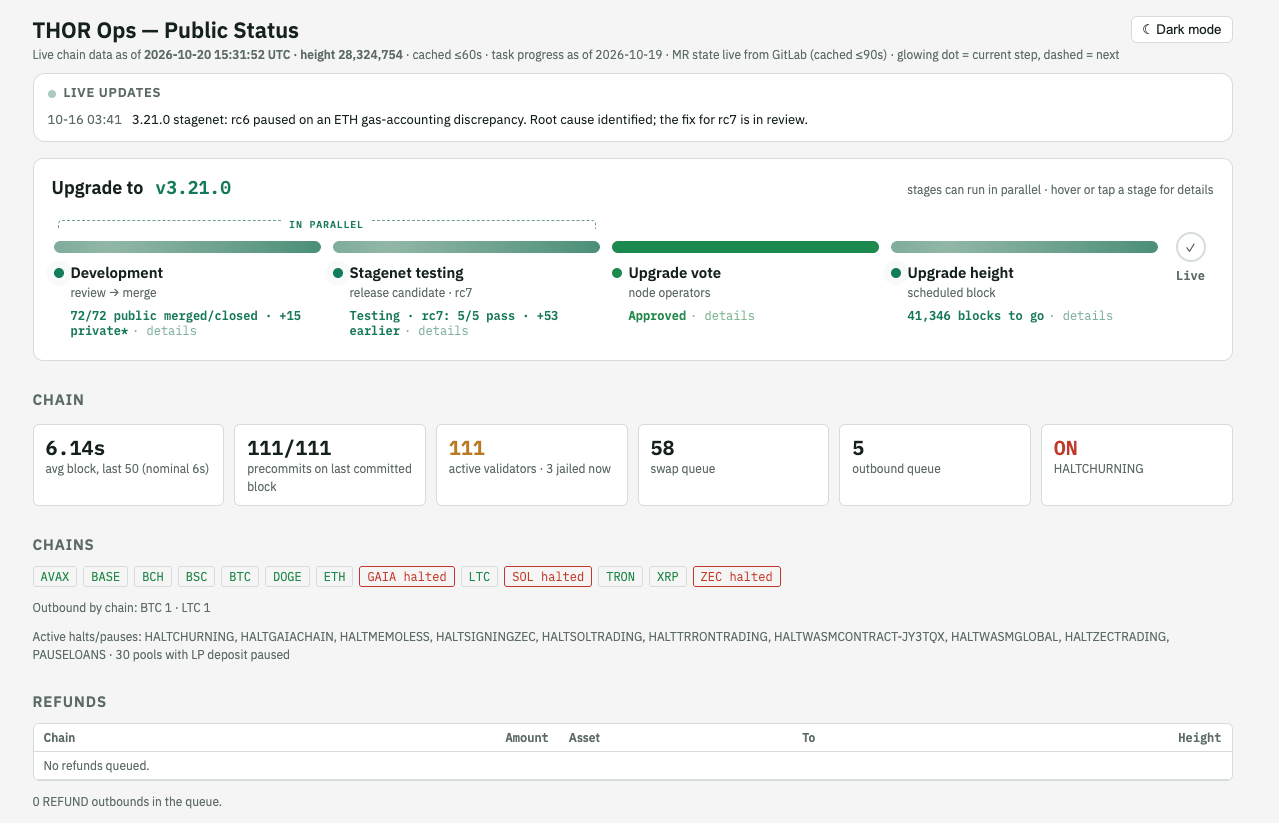
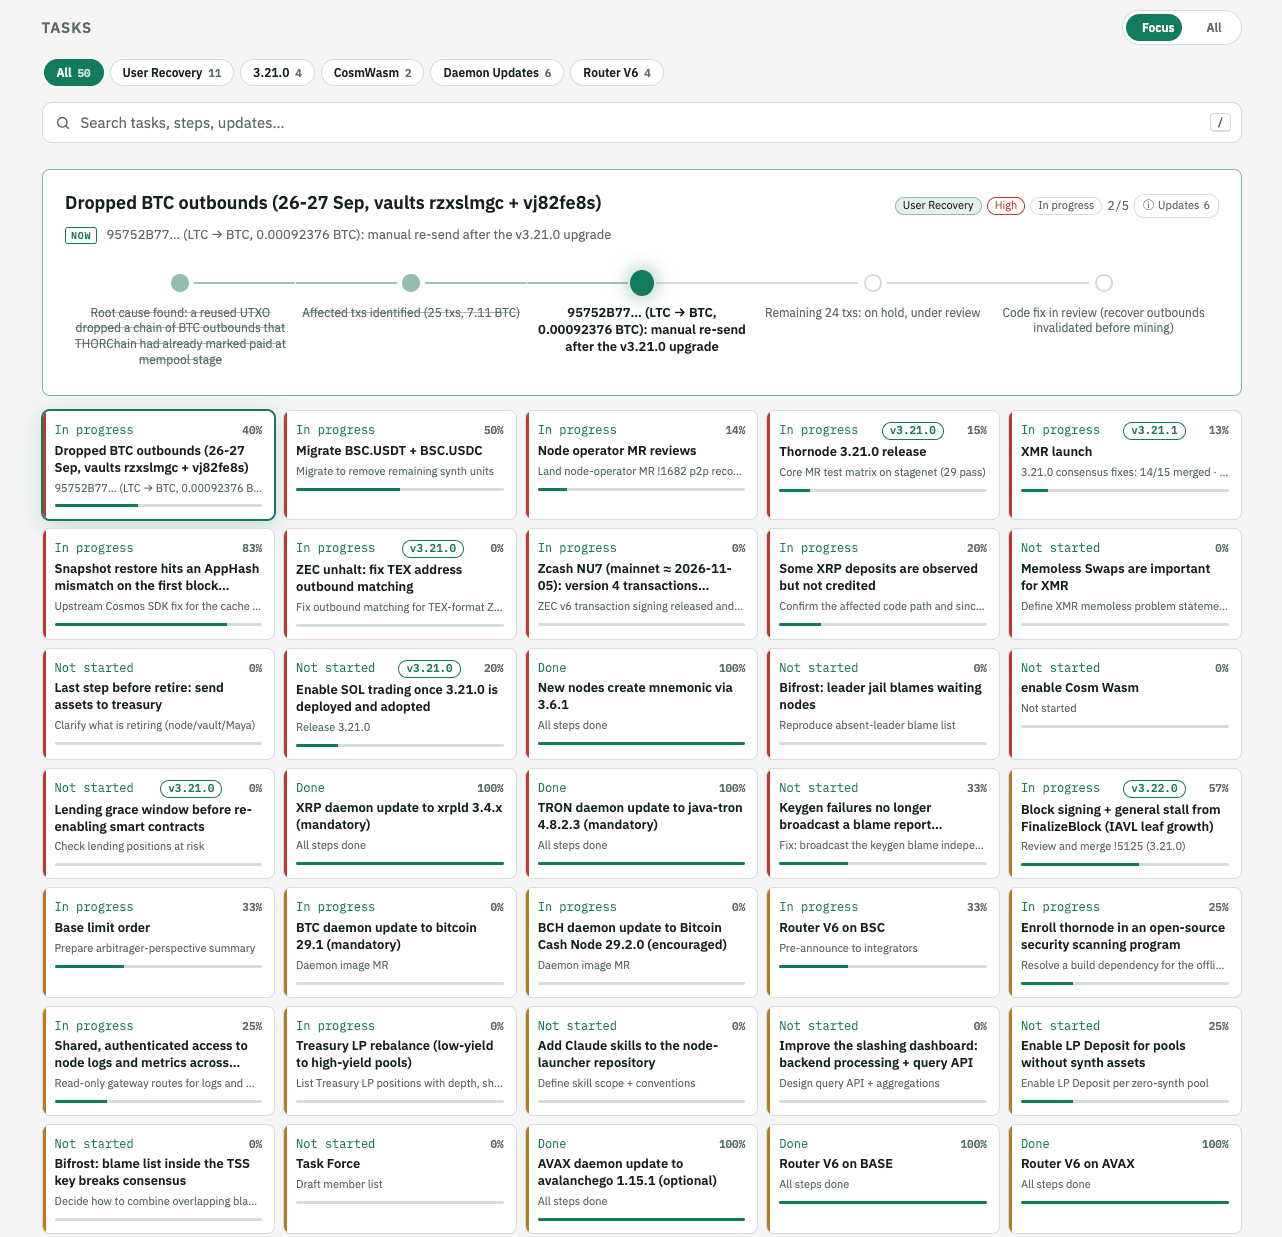
What THORChain builds is now public and live at devops.thorchain.org. What it costs is reported in full every quarter in this report.
- Upgrade pipeline: every release, from development and stagenet testing to the node vote and the upgrade height.
- Chain health: block time, validator set, swap and outbound queues, and halts per chain.
- 50 tracked tasks: progress, priority, and step-by-step updates, from user recovery to daemon updates.
- Live updates: incidents and fixes posted as they happen.
Suggestion for Nodes
The Coordination Group suggests raising the Dev & Ops Fund allocation from 5% to 8 to 10% of protocol revenue.
Today (5%) | Proposed (8 to 10%) | |
|---|---|---|
Dev & Ops Fund income per quarter, at Q3 actual revenue | USD 155k | USD 248k to 310k |
Self-funded share | 22.6% | 36% to 45% |
Treasury draw per month | USD 176k | USD 125k to 146k |
Why Now
- Q3 spend is already at its lowest monthly level since handover, USD 203k in September.
- The fund paid for ZEC, XMR, rev share, and dynamic fees, the work that is now growing protocol income.
- At 5%, the Treasury still carries 77% of the cost of running the protocol.
Our Suggestion
Set the allocation at 8 to 10% and hold it for six months, then revisit against Q4 and Q1 actuals. The Treasury continues to fund the remaining shortfall and is staking available assets such as TCY to grow its own revenue. The aim remains for the Dev & Ops Fund to carry more of its own cost each quarter.
Release progress, stagenet test results, chain health, and open operational tasks are published live at devops.thorchain.org. Node operators can withhold Dev & Ops Fund disbursement by vote at any time.

Related articles
![Thumbnail for the THORChain Q3 2026 Quarterly Report, covering $3.82B in volume, $4.57M in fees, the v3.20 upgrade, Protocol-Owned Liquidity and upcoming chain launches.]()
Oct. 23, 2026
THORChain Quarterly Report - Q3 2026
- Quarterly Report
![]()
Apr. 30, 2026
THORChain Quarterly report - Q1 2026
- Quarterly Report
![]()
Jan. 21, 2026
THORChain Q4 2025 Ecosystem Report & 2026 Roadmap
- Quarterly Report
![]()
Oct. 8, 2025
THORChain Q3 2025 Ecosystem Report & Q4 Roadmap
- Quarterly Report
![]()
Jul. 9, 2025
THORChain Q2 2025 Ecosystem Report & Q3 Roadmap
- Quarterly Report
![]()
Apr. 7, 2025
THORChain Q1 2025 Report & Q2 Roadmap
- Quarterly Report
![]()
Jan. 8, 2025
THORChain 2024 Year End Report & Q4 Report
- Quarterly Report
![]()
Oct. 7, 2024
THORChain Q3 2024 Ecosystem Report
- Quarterly Report
![]()
Jul. 11, 2024
THORChain Q2 2024 Ecosystem Report
- Quarterly Report
![]()
Apr. 15, 2024
THORChain Q1 ’24 Ecosystem Report
- Quarterly Report
![]()
Jan. 23, 2024
THORChain Ecosystem Q4`23 Report & 2024 Roadmap
- Quarterly Report
![]()
Oct. 4, 2023
THORChain Q3 ’23 Ecosystem Report
- Quarterly Report
![]()
Jul. 5, 2023
THORChain Q2 ’23 Ecosystem Report
- Quarterly Report
![]()
Apr. 6, 2023
THORChain Q1 ‘23 Ecosystem Report
- Quarterly Report
![]()
Apr. 1, 2022
Quarterly Treasury Report — Q1 2022
- Quarterly Report