State of the Network - January 2026
Welcome to the January edition. This month, we track security, liquidity, volume, fees, user activity, and supply across THORChain.
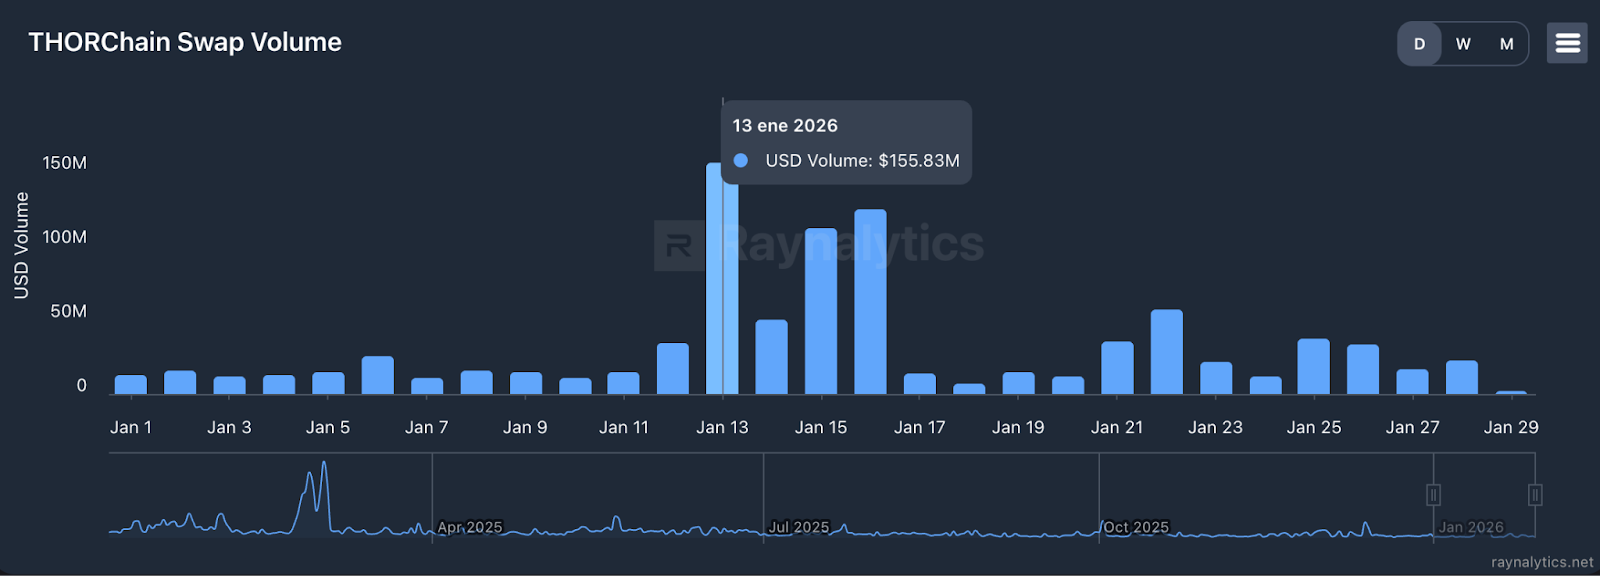
January was rough. Volume dropped to $920M from December's $1.44B as crypto bled attention to other assets. But two transactions changed the conversation: $21.7M and $31.2M in BTC to ETH; the largest swaps THORChain has ever processed, and among the largest in DeFi history.
Let's break down what happened. ⬇️
1️⃣ Volume and Fees
🔹Two Large Swaps
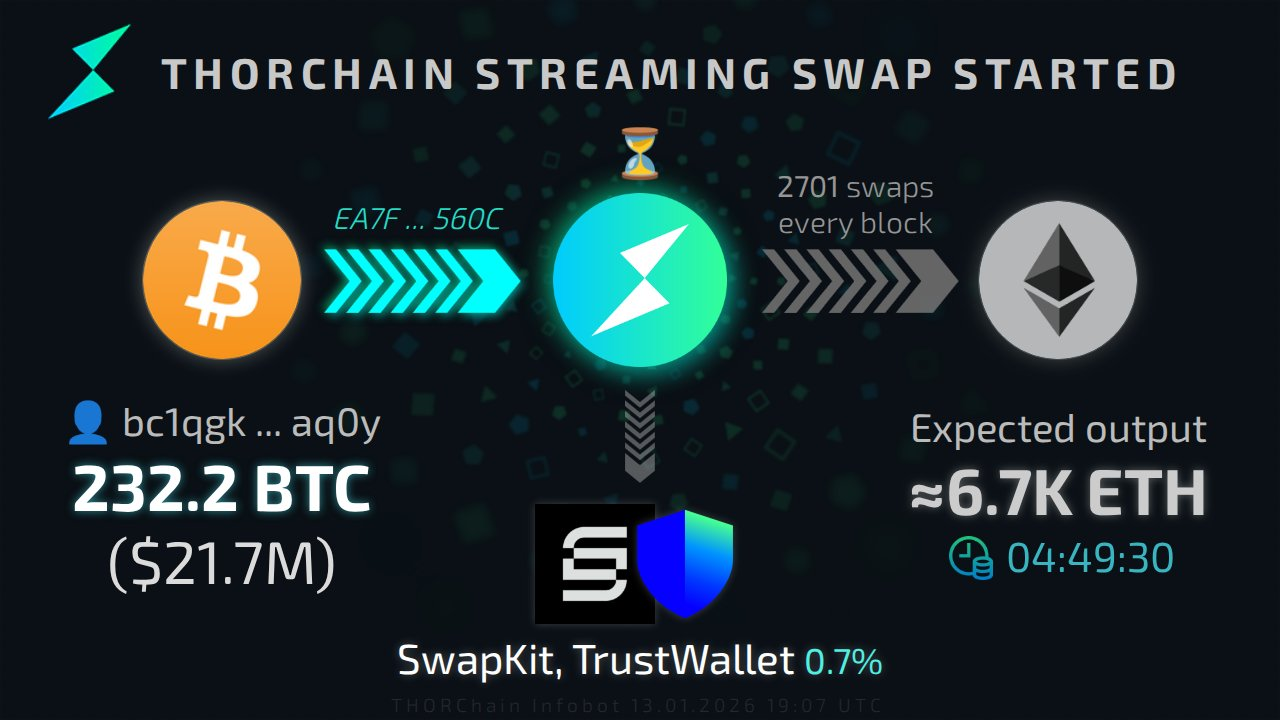
On the 13th of January, someone swapped $21.7M worth of BTC for ETH. Days later, another swapped $31.2M through the same route. Both transactions settled through SwapKit's routing via TrustWallet's frontend.
These transactions set a world record as the largest swaps ever executed in DeFi history through a purely permissionless environment. The infrastructure handled them without issues; no network pauses, no failed transactions, no degradation alongside regular retail volume.
Regardless of the origin of these funds, it's important to highlight the technical capabilities THORChain has achieved and what this represents for DeFi. A few years back, swapping these amounts in a purely decentralized way with only native assets was simply impossible. No wrapped tokens, no bridges, no multisig approvals. Just native BTC turning into native ETH through bonded validators. DeFi has progressed massively. 👏
What these transactions prove: DeFi isn't just for retail anymore. When someone needs to move $30M between chains, they can now choose decentralized infrastructure over centralized alternatives. That choice exists because the technology finally works at institutional scale. The protocol absorbed flows of this magnitude as if they were routine trades, demonstrating that permissionless systems can compete with traditional finance on capacity, not just ideology.
This is infrastructure operating exactly as designed. Native settlement. No intermediaries. Transparent execution. Whether you're swapping $500 or $30M, the mechanism works identically.

How a $30M Swap Actually Worked
Here's what makes this technically impressive: the user got more than they were quoted.
The swap started with 323 BTC converting to ETH, valued at over $30M. THORChain's pools held roughly 2,500 ETH at the time; nowhere near enough liquidity to handle this in a single transaction without massive slippage.
Enter streaming swaps. Instead of one catastrophic trade that would destroy pricing, the protocol automatically split the swap into 3,608 smaller transactions executed every 2 THORChain blocks over 13 hours. SwapKit, the integration toolkit TrustWallet uses to connect to THORChain, chose the 2 block interval strategically: it gives arbitrage bots time to spot price differences, buy cheaper assets elsewhere, add liquidity to THORChain pools, and profit from the gap.
The protocol incentivizes arbitrage bots to become the liquidity exactly when it's needed. The bigger the swap, the more profitable the arbitrage, the faster pools rebalance.
The result: the user was quoted 9,192.55 ETH. They actually received 9,240.64 ETH. That's 48 MORE ETH than expected. During those 13 hours, ETH/BTC price dropped 1.93% on external markets. The streaming execution captured that price movement in the user's favor.
Most DEXs and bridges fail at scale because they're constrained by whatever liquidity sits idle in their pools. THORChain's design makes arbitrage profitable, so market makers automatically provide liquidity exactly when demand spikes. This is how you process institutional-scale flows without centralized market makers or pre-arranged liquidity. You let economics do the work.
🔹General Volume
Beyond those outliers, January was a slow month on THORChain, with around $216M in weekly volume. This aligns with a broader trend across both CEXs and DEXs, as Bitcoin traded sideways, altcoins bled and traditional assets absorbed capital. A classic rotation pattern that typically precedes either capitulation or accumulation, market participants will find out which one it is in the coming months.
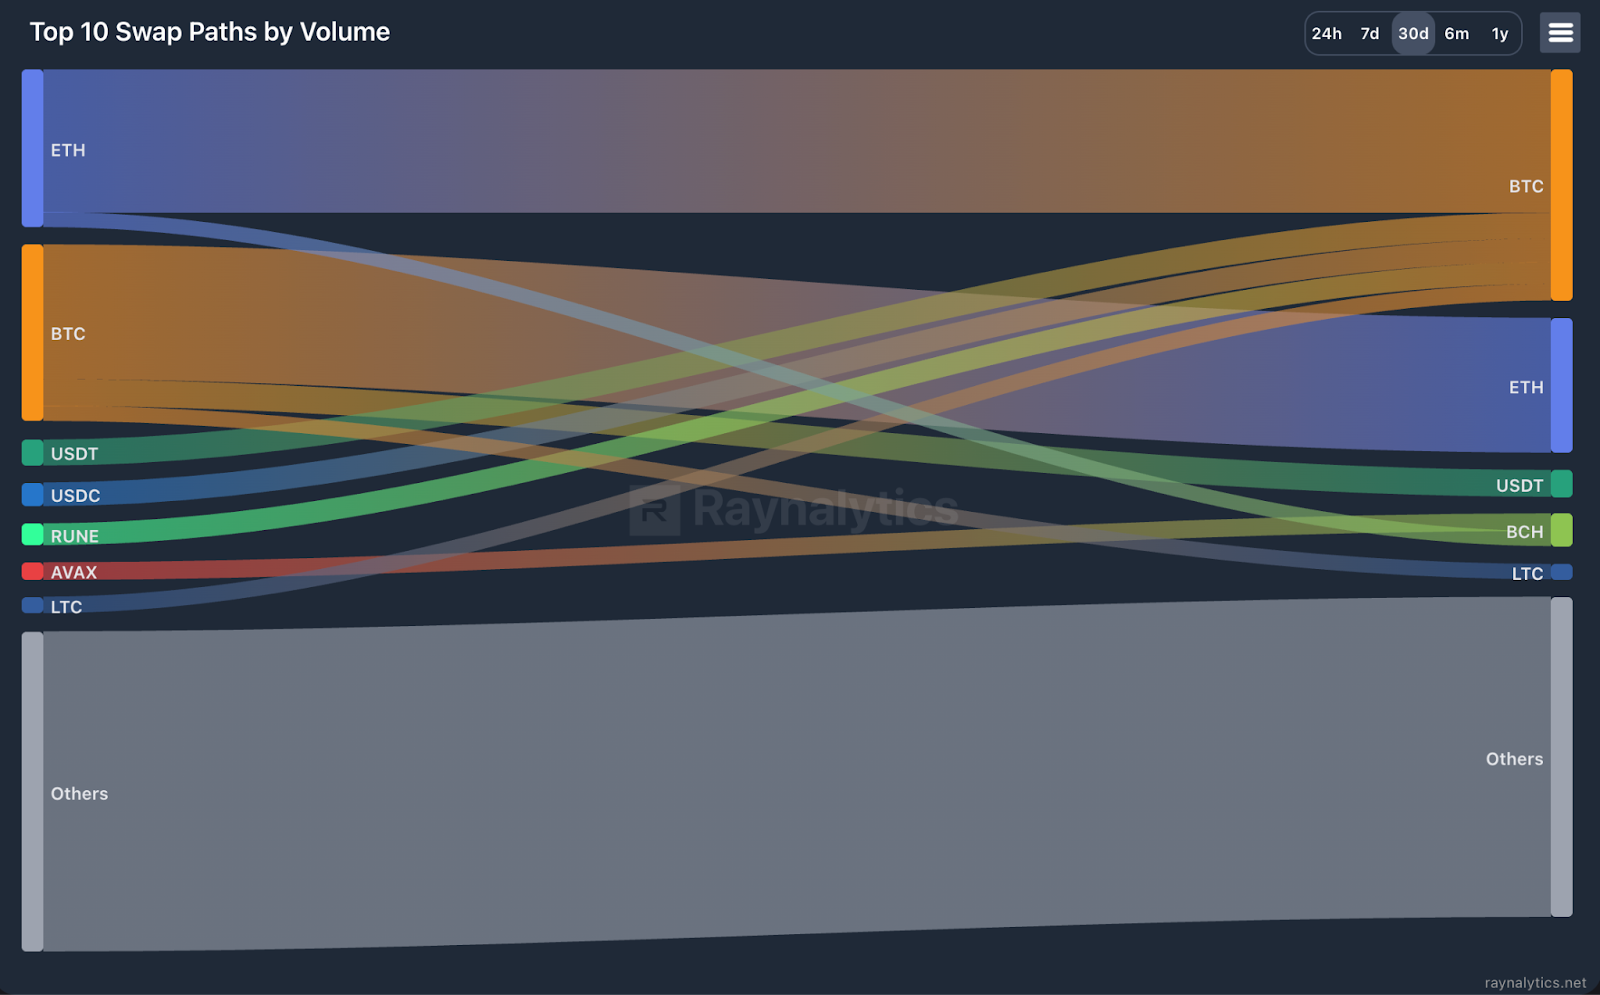
🔹Swap Paths
The new Swap Paths interface on Raynalytics highlights the main routes users are taking over the last 30 days, ranked by volume. As expected, Bitcoin and Ethereum clearly dominate, acting as the primary entry and exit points for the majority of cross-chain volume on THORChain.
Fees collected
Fee generation tracked volume's decline with one exception: those two large swaps contributed disproportionately to January's total revenue. Each transaction generated more system income than multiple days of baseline activity combined.
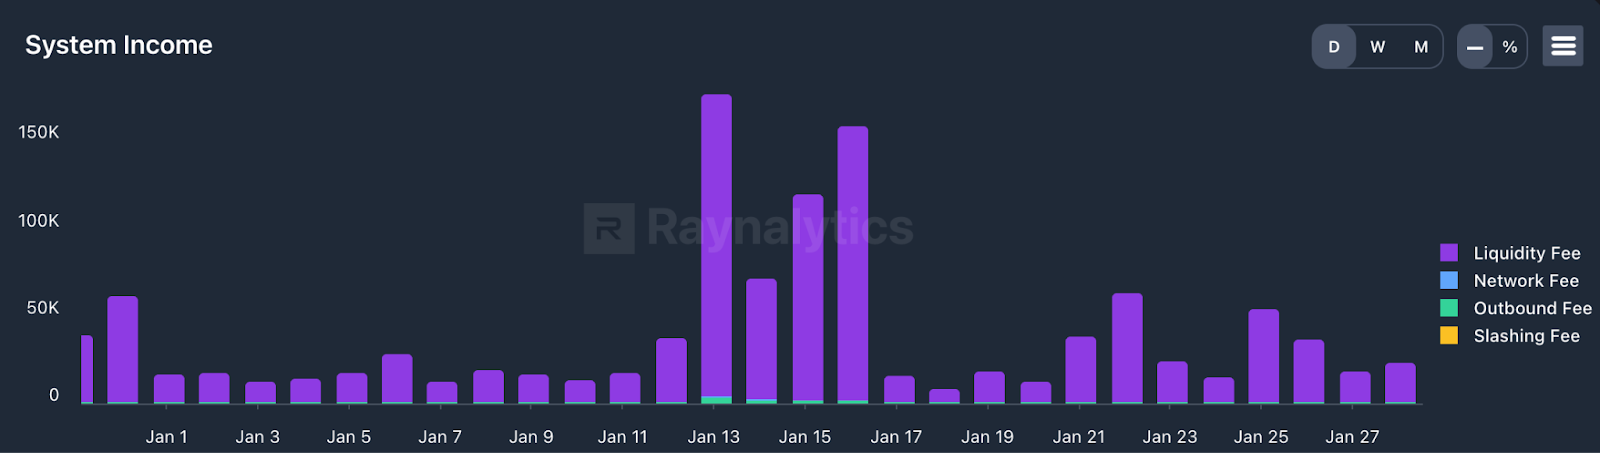
Total system income declined from December's $1.6M to $1.1M in January. A 32% decline that mirrors the volume contraction and the shift in sentiment in crypto. Still, no matter the market conditions, THORChain continues generating meaningful revenue.
2️⃣ TCY and RUNE Yield
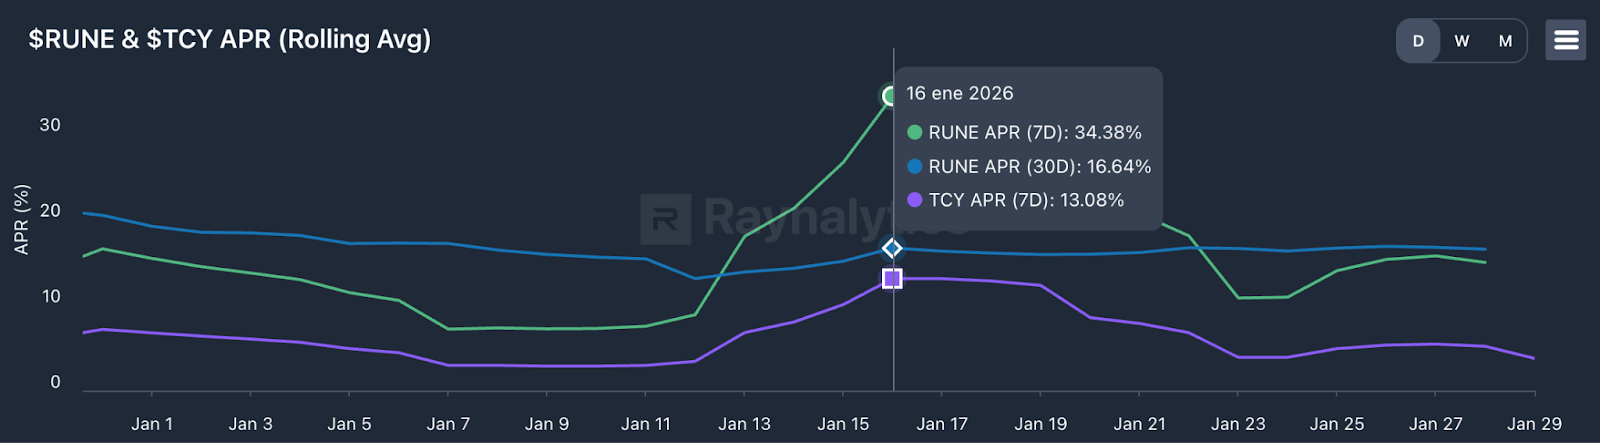
January's yields stayed remarkably stable until those two massive swaps hit mid-month.
RUNE held around 15% APR through the first half of January before spiking to 34.38% on January 16th when the large transactions processed. Yields settled back to baseline by month's end, with the 30-day average landing at 16.64%.
TCY followed the same pattern: stable around 5% before jumping to 13.08% mid-month, then returning to roughly 3% as January closed.
The key takeaway is that stakers and bonders keep earning. A 16.64% APR on bonded RUNE remains solid, especially in a month when most of crypto sat idle. TCY holders continued receiving their share of protocol revenue despite reduced volume. January proved the mechanism functions whether the market is euphoric or scared.
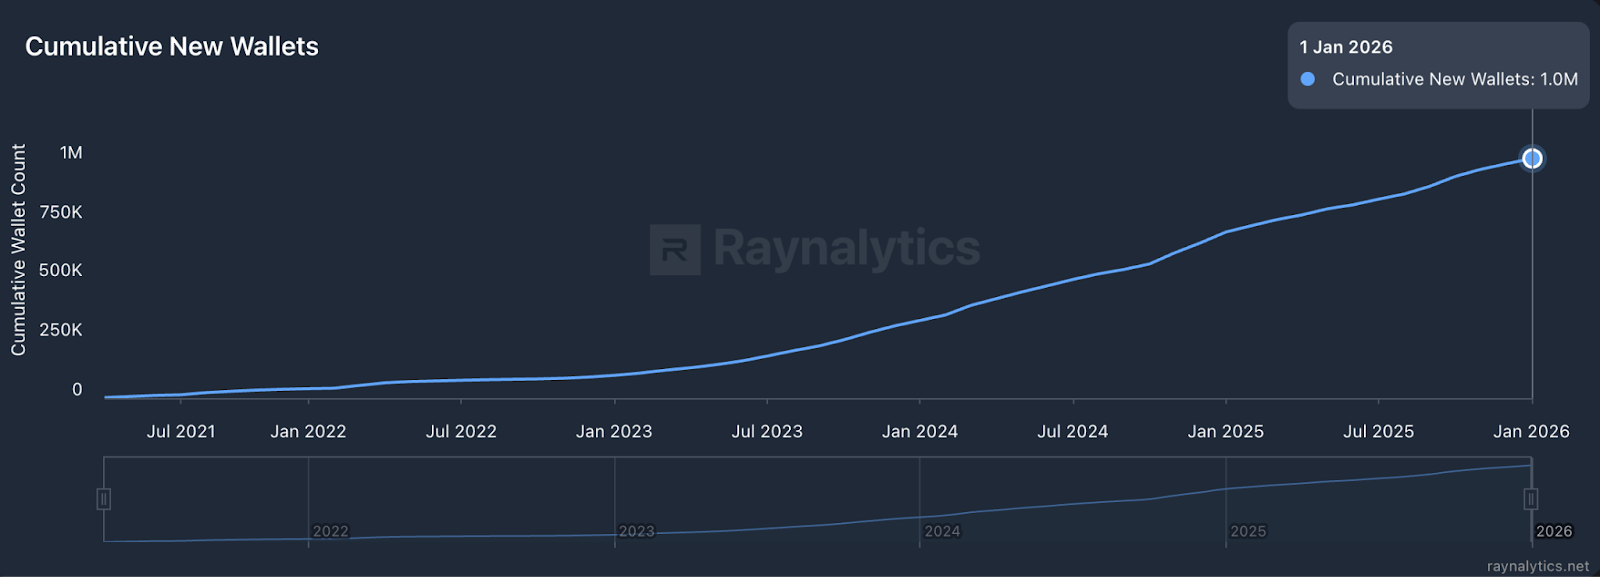
3️⃣ Retention and User Acquisition
January started with a milestone worth noting: THORChain crossed one million cumulative unique wallets. Not one million registered accounts or email signups. One million actual wallets that executed at least one swap through the protocol since inception.The growth curve tells an interesting story. The first 500k wallets took roughly three years to accumulate. The second 500k arrived in under 18 months. THORChain adoption is accelerating.
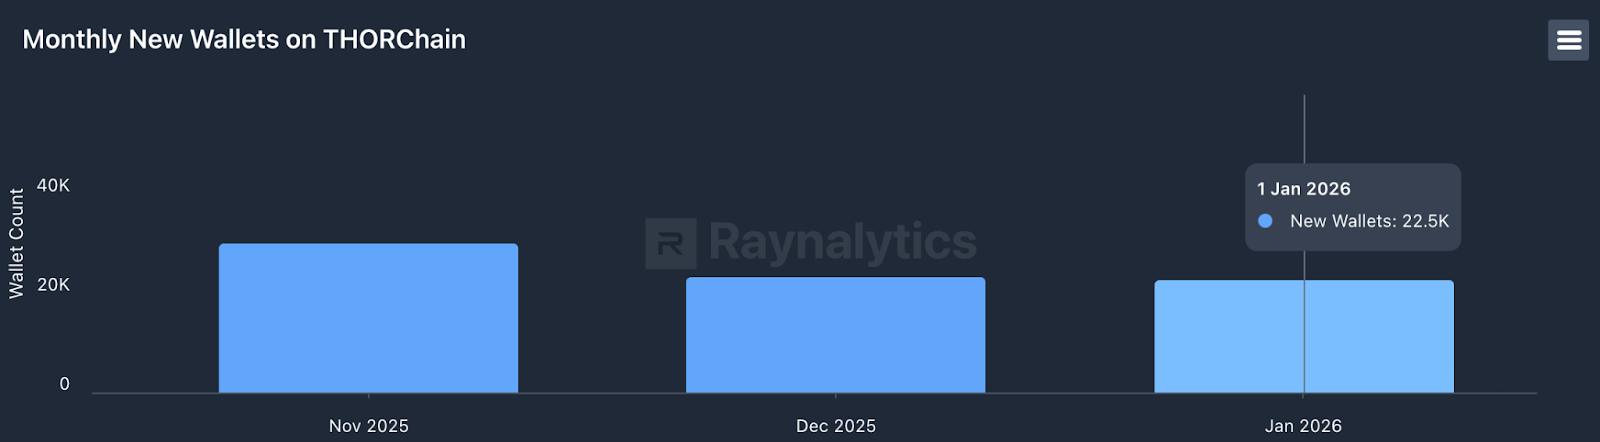
As for new users, January matched December's new wallet count at approximately 22K, maintaining the slower pace from the holiday period as the market loses interest in crypto.
4️⃣Security and Supply
🔹 Bonds
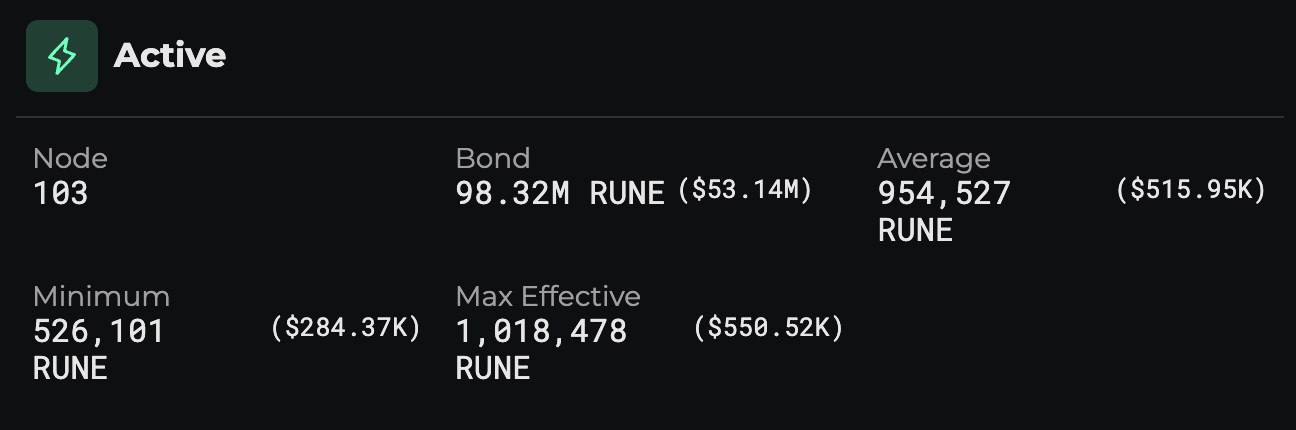
Node count remains relatively steady with 103 nodes (104 in December). Total bonded capital held essentially flat at 98.32M RUNE ($53.29M), with the average bond per node sitting at $517k.
Here's what matters: the network maintained over $53M in bonded security during one of crypto's quietest months. Node operators kept their capital locked even as yields compressed and volume dried up.
If you're holding RUNE and wondering what to do with it, bonding to a node remains one of the most direct ways to earn protocol revenue and participate in the growth of the network. By bonding, you're securing infrastructure that processes real cross-chain swaps, and you earn a proportional share of the fees those swaps generate.
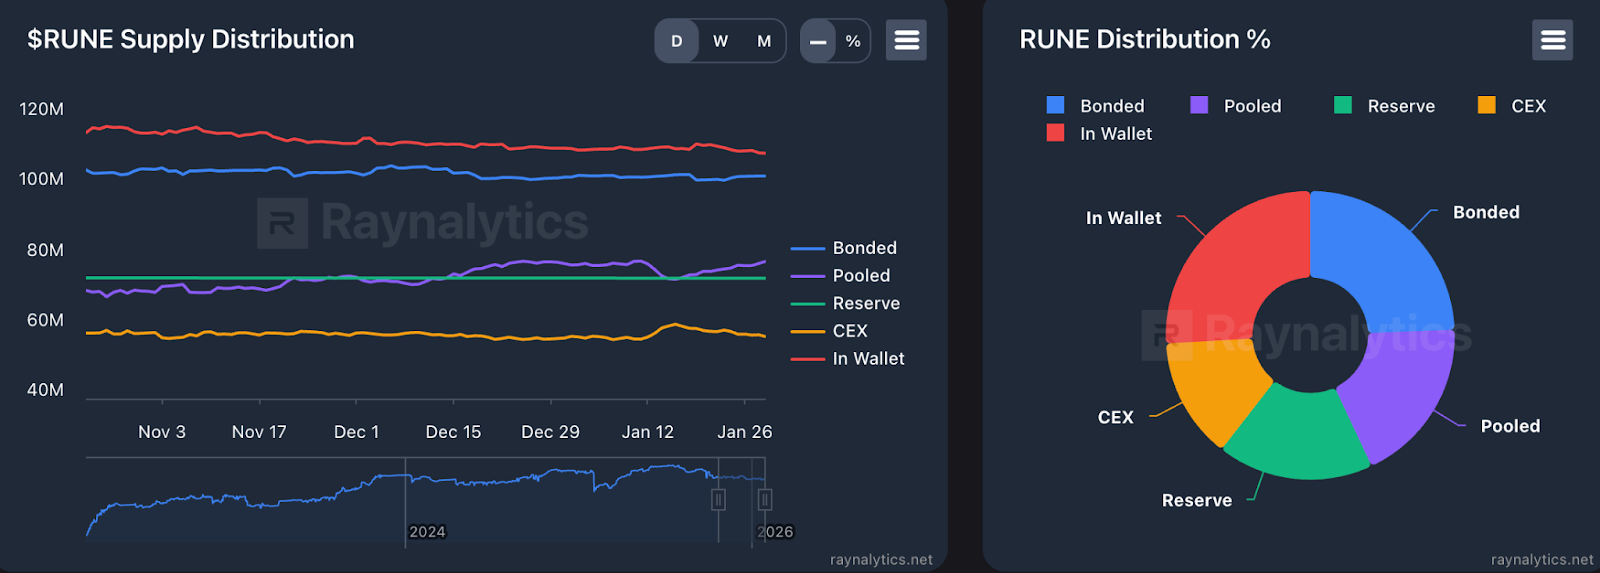
🔹 Supply
January’s supply distribution showed continued high stability with very little movement from December. RUNE allocation remained consistent across categories, with healthy trends persisting as tokens continue to support productive protocol usage (bonding and liquidity pools) rather than concentrating on centralised exchanges.
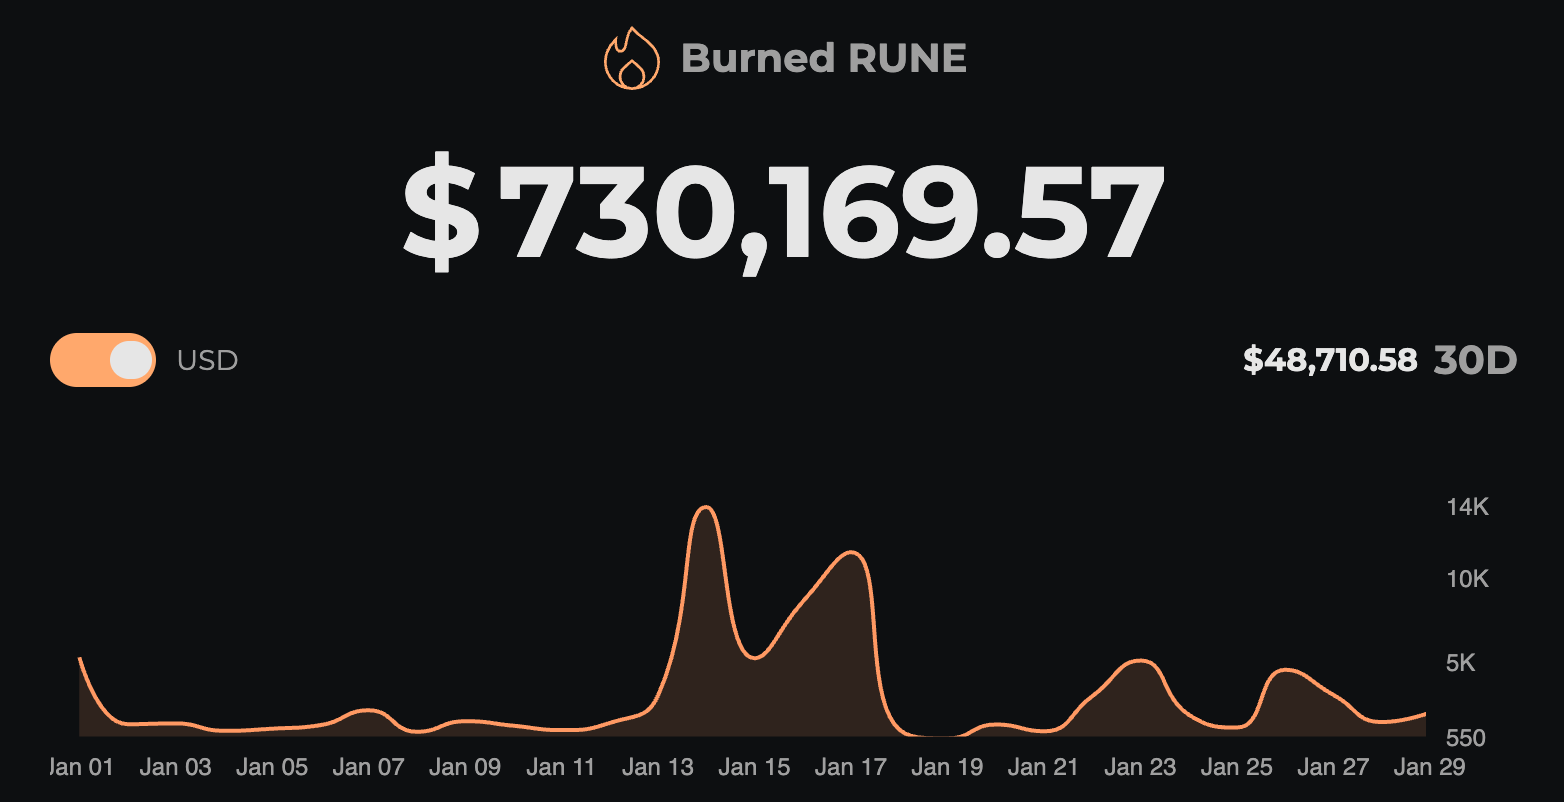
🔹 Burn
The burn mechanism removed ~$48K in RUNE during January, tracking the month's reduced fee generation with mechanical precision. Total burned since inception now sits at $730k.
January's burn pattern tells you everything you need to know about how transparent this system is. Early in the month, daily burns hovered around $2K to $3K as volume remained steady. Then came the two massive swaps on January 13th and 16th, spiking burns above $13k on those specific days as fees surged. By month's end, burns had compressed back below $2k daily, mirroring the volume collapse perfectly.
5️⃣ Frontends
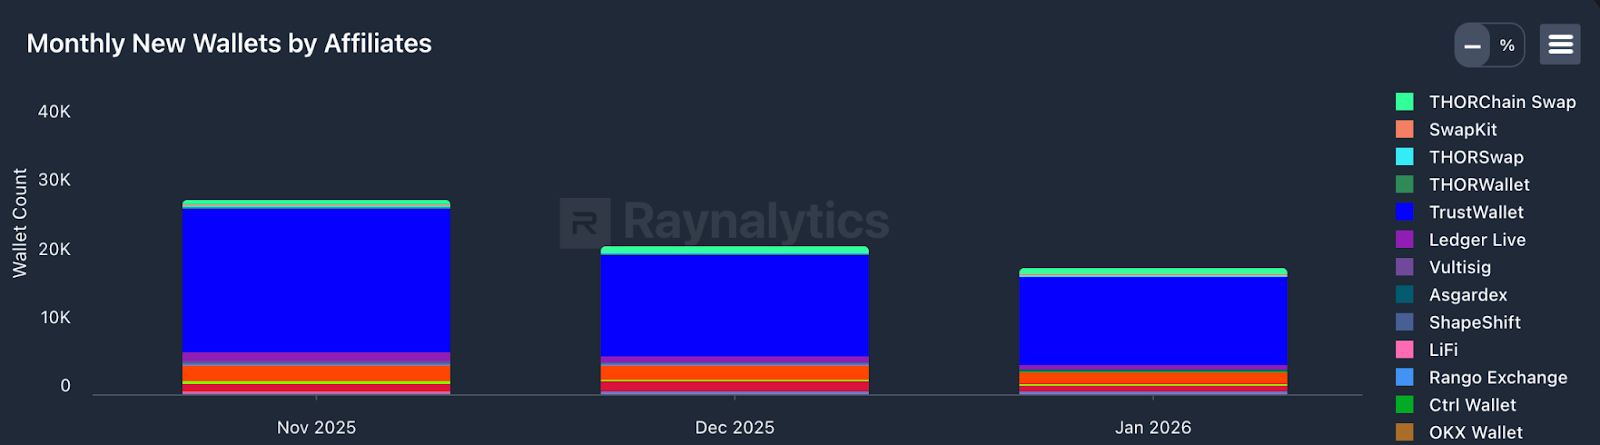
🔹Swapper Acquisition
TrustWallet remained the leading frontend by swapper acquisition in January, continuing to dominate new user onboarding with 13k new wallets.
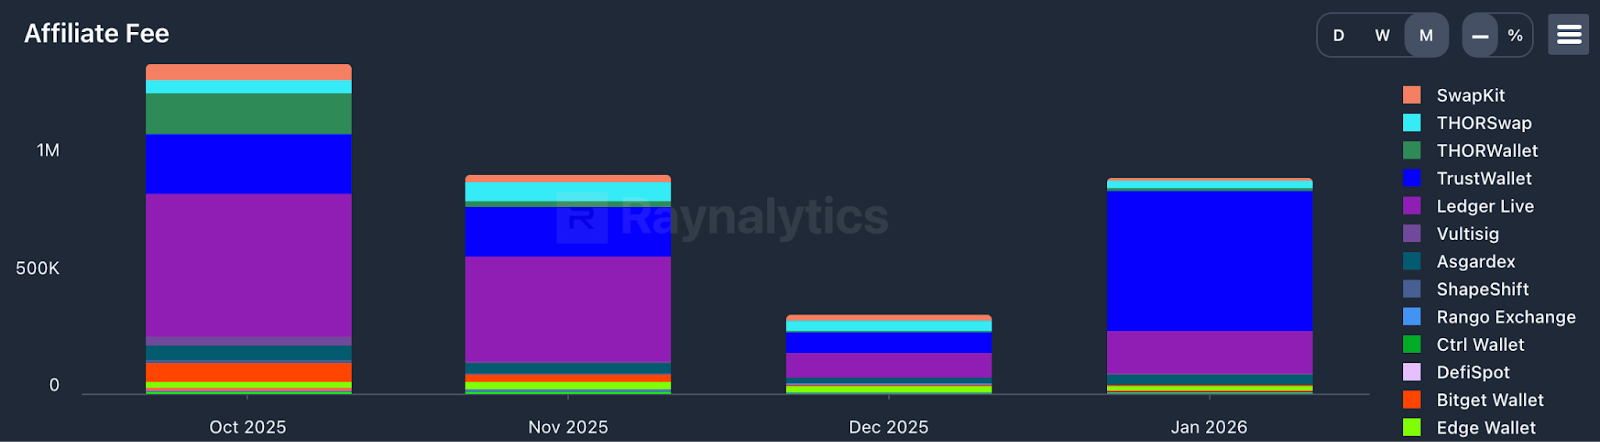
🔹Leaderboard by Fees
Affiliate fees saw significant growth in January, highlighting the strength of THORChain's open integration model and the revenue potential for frontends driving swap volume.
TrustWallet surged to the lead in January, with earnings spiking from $85k in December to $596k. Ledger followed, growing from $105k in December (when it held the top spot) to $181k in January.
If you're a builder, wallet dev, dApp creator…what are you waiting for? Integrate THORChain today and start earning real affiliate fees on every swap.
6️⃣ Key Takeaways
January was quiet for THORChain amid broader market sideways action, with swap volume dropping about 36% to $920M and system income falling 32% to $1.1M. Two record breaking BTC to ETH swaps ($21.7M and $31.2M, the largest ever processed on THORChain and in DeFi history) demonstrated the protocol's ability to handle massive flows reliably through TrustWallet and SwapKit routing, without any issues. These outliers significantly boosted revenue for the protocol.
Cumulative unique wallets surpassed 1M, with adoption accelerating (second 500K in under 18 months). Supply distribution remained stable and productive with about $53M bonded for security with minimal node churn. User acquisition is still effective with TrustWallet leading the way. As per the affiliate fees, TrustWallet led the month (about $596K), followed by Ledger (about $181K).If there are specific metrics or themes you want included in future editions, drop your requests in the comments. We'll add the most relevant ones next month.
Data Sources: RuneTools, THORCharts, THORChain Explorer, Raynalitics, Dune