Introducing THORChain’s DefiLlama Investor Relations Dashboard

2026-09-14 — 5 min read
- Marketing
THORChain now has a dedicated Investor Relations dashboard on DeFiLlama, giving users, researchers, and investors a single place to track the protocol’s key fundamentals.
The dashboard brings together independently verified data on activity, fees, liquidity, nodes, bonding, token metrics, and other custom THORChain indicators, making it easier to understand how the network is being used and what is driving its growth.
Link to the dashboard: https://investors.defillama.com/thorchain
Get Insights Into THORChain’s Financials
On the first page of the dashboard, users get a detailed look at THORChain’s financials and how activity on the network translates into fees and revenue.
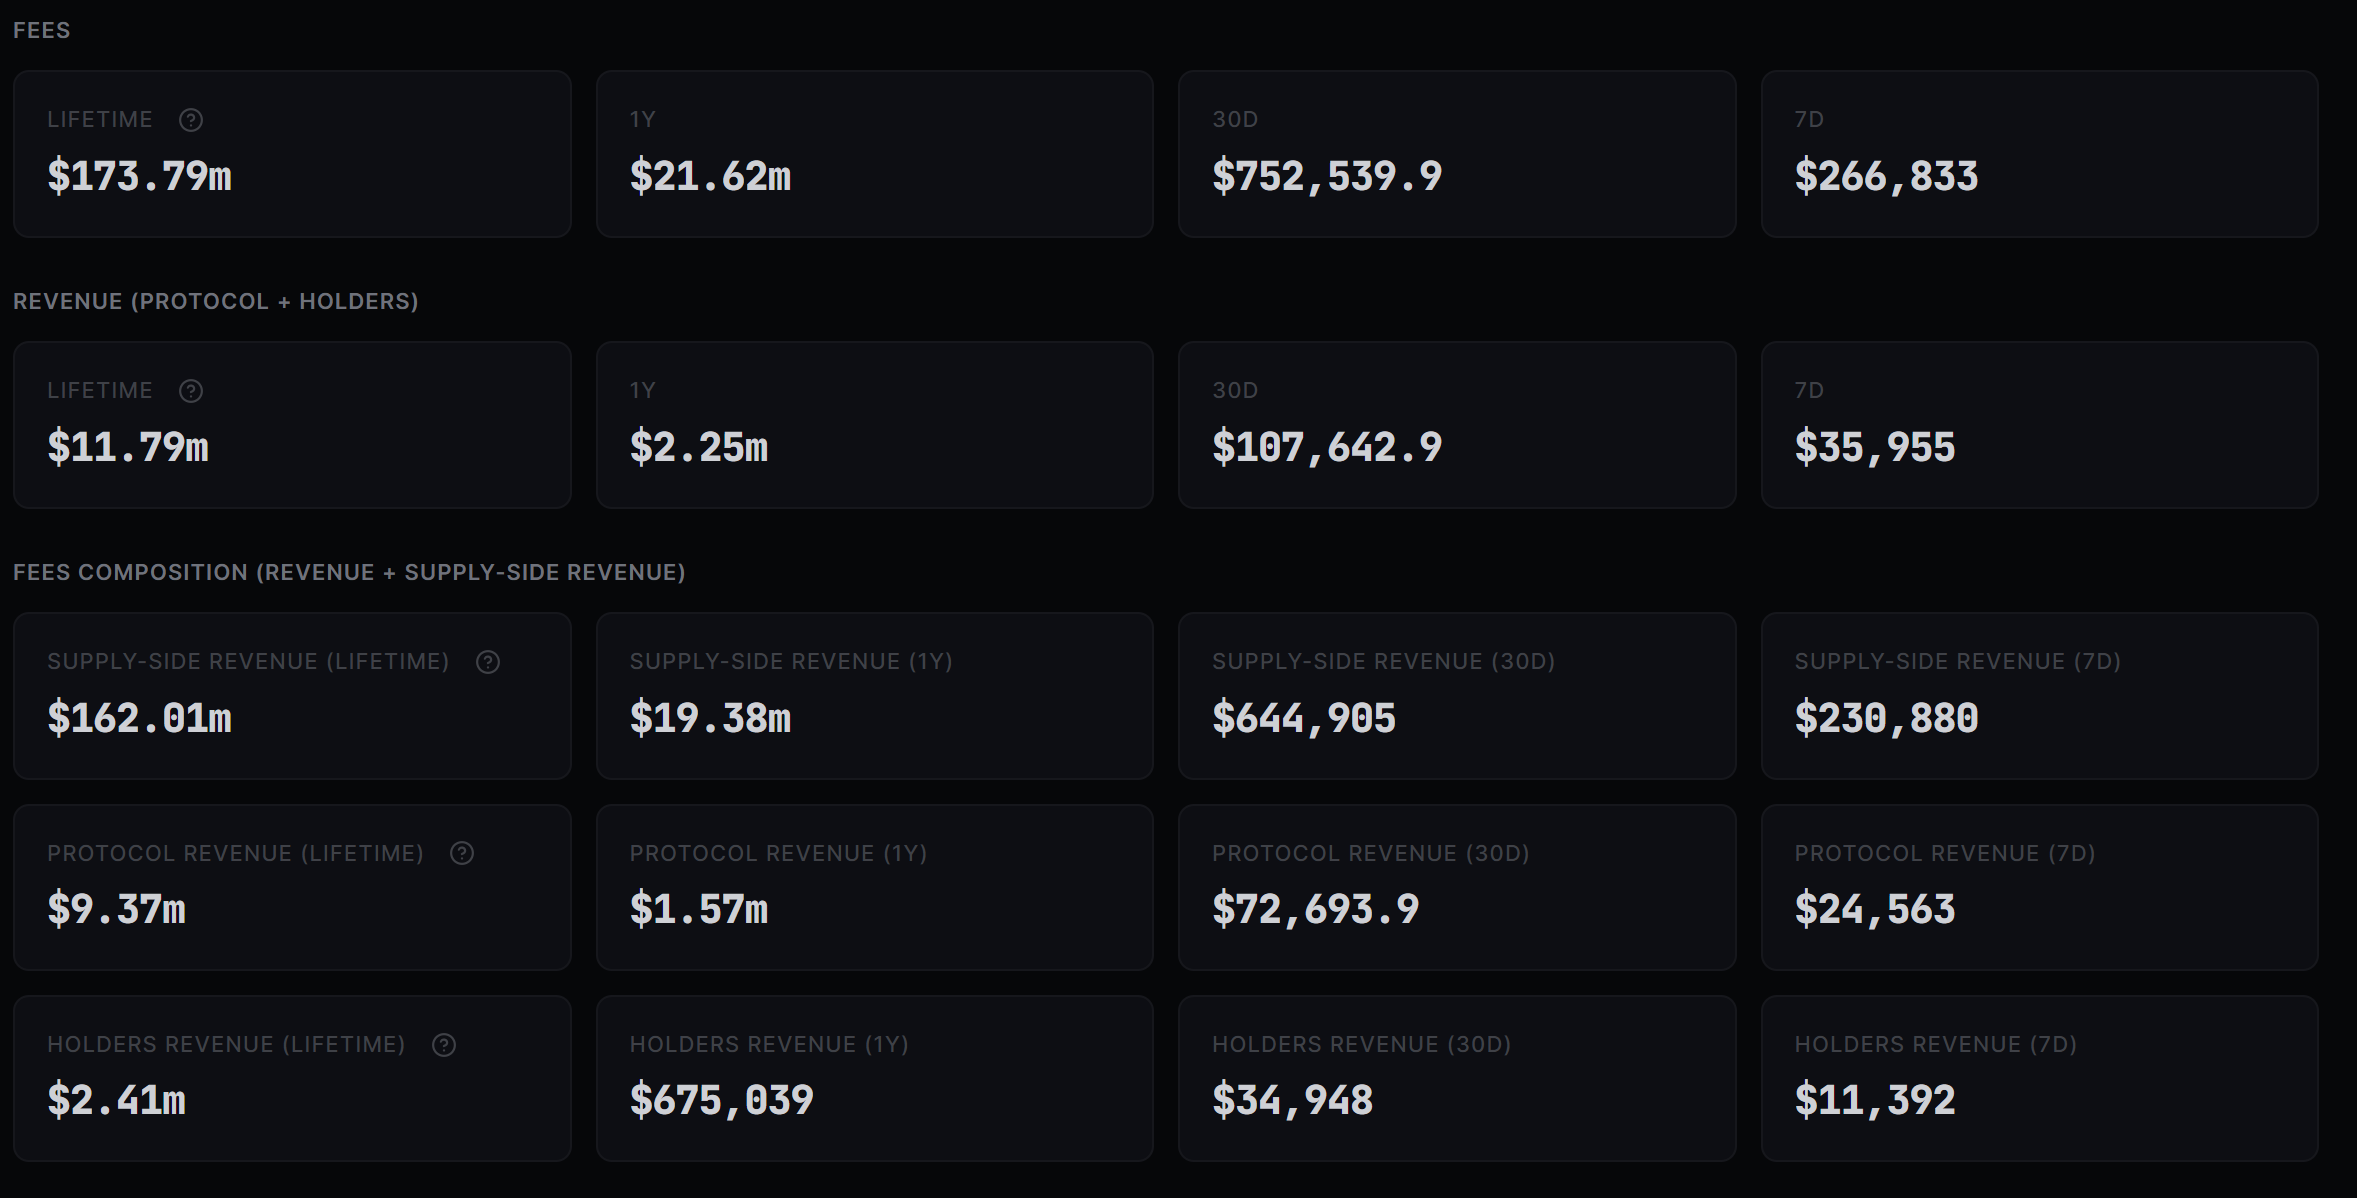
The top of the page shows THORChain’s total fees and revenue across several time periods, including the past seven days, 30 days, one year, and the protocol’s full lifetime.
Users can then look at where those fees go. The dashboard separates supply-side revenue, protocol revenue, and holder revenue, while also showing fees and revenue by chain. This makes it easier to understand not only how much economic activity THORChain generates, but also how that value is distributed across the network.
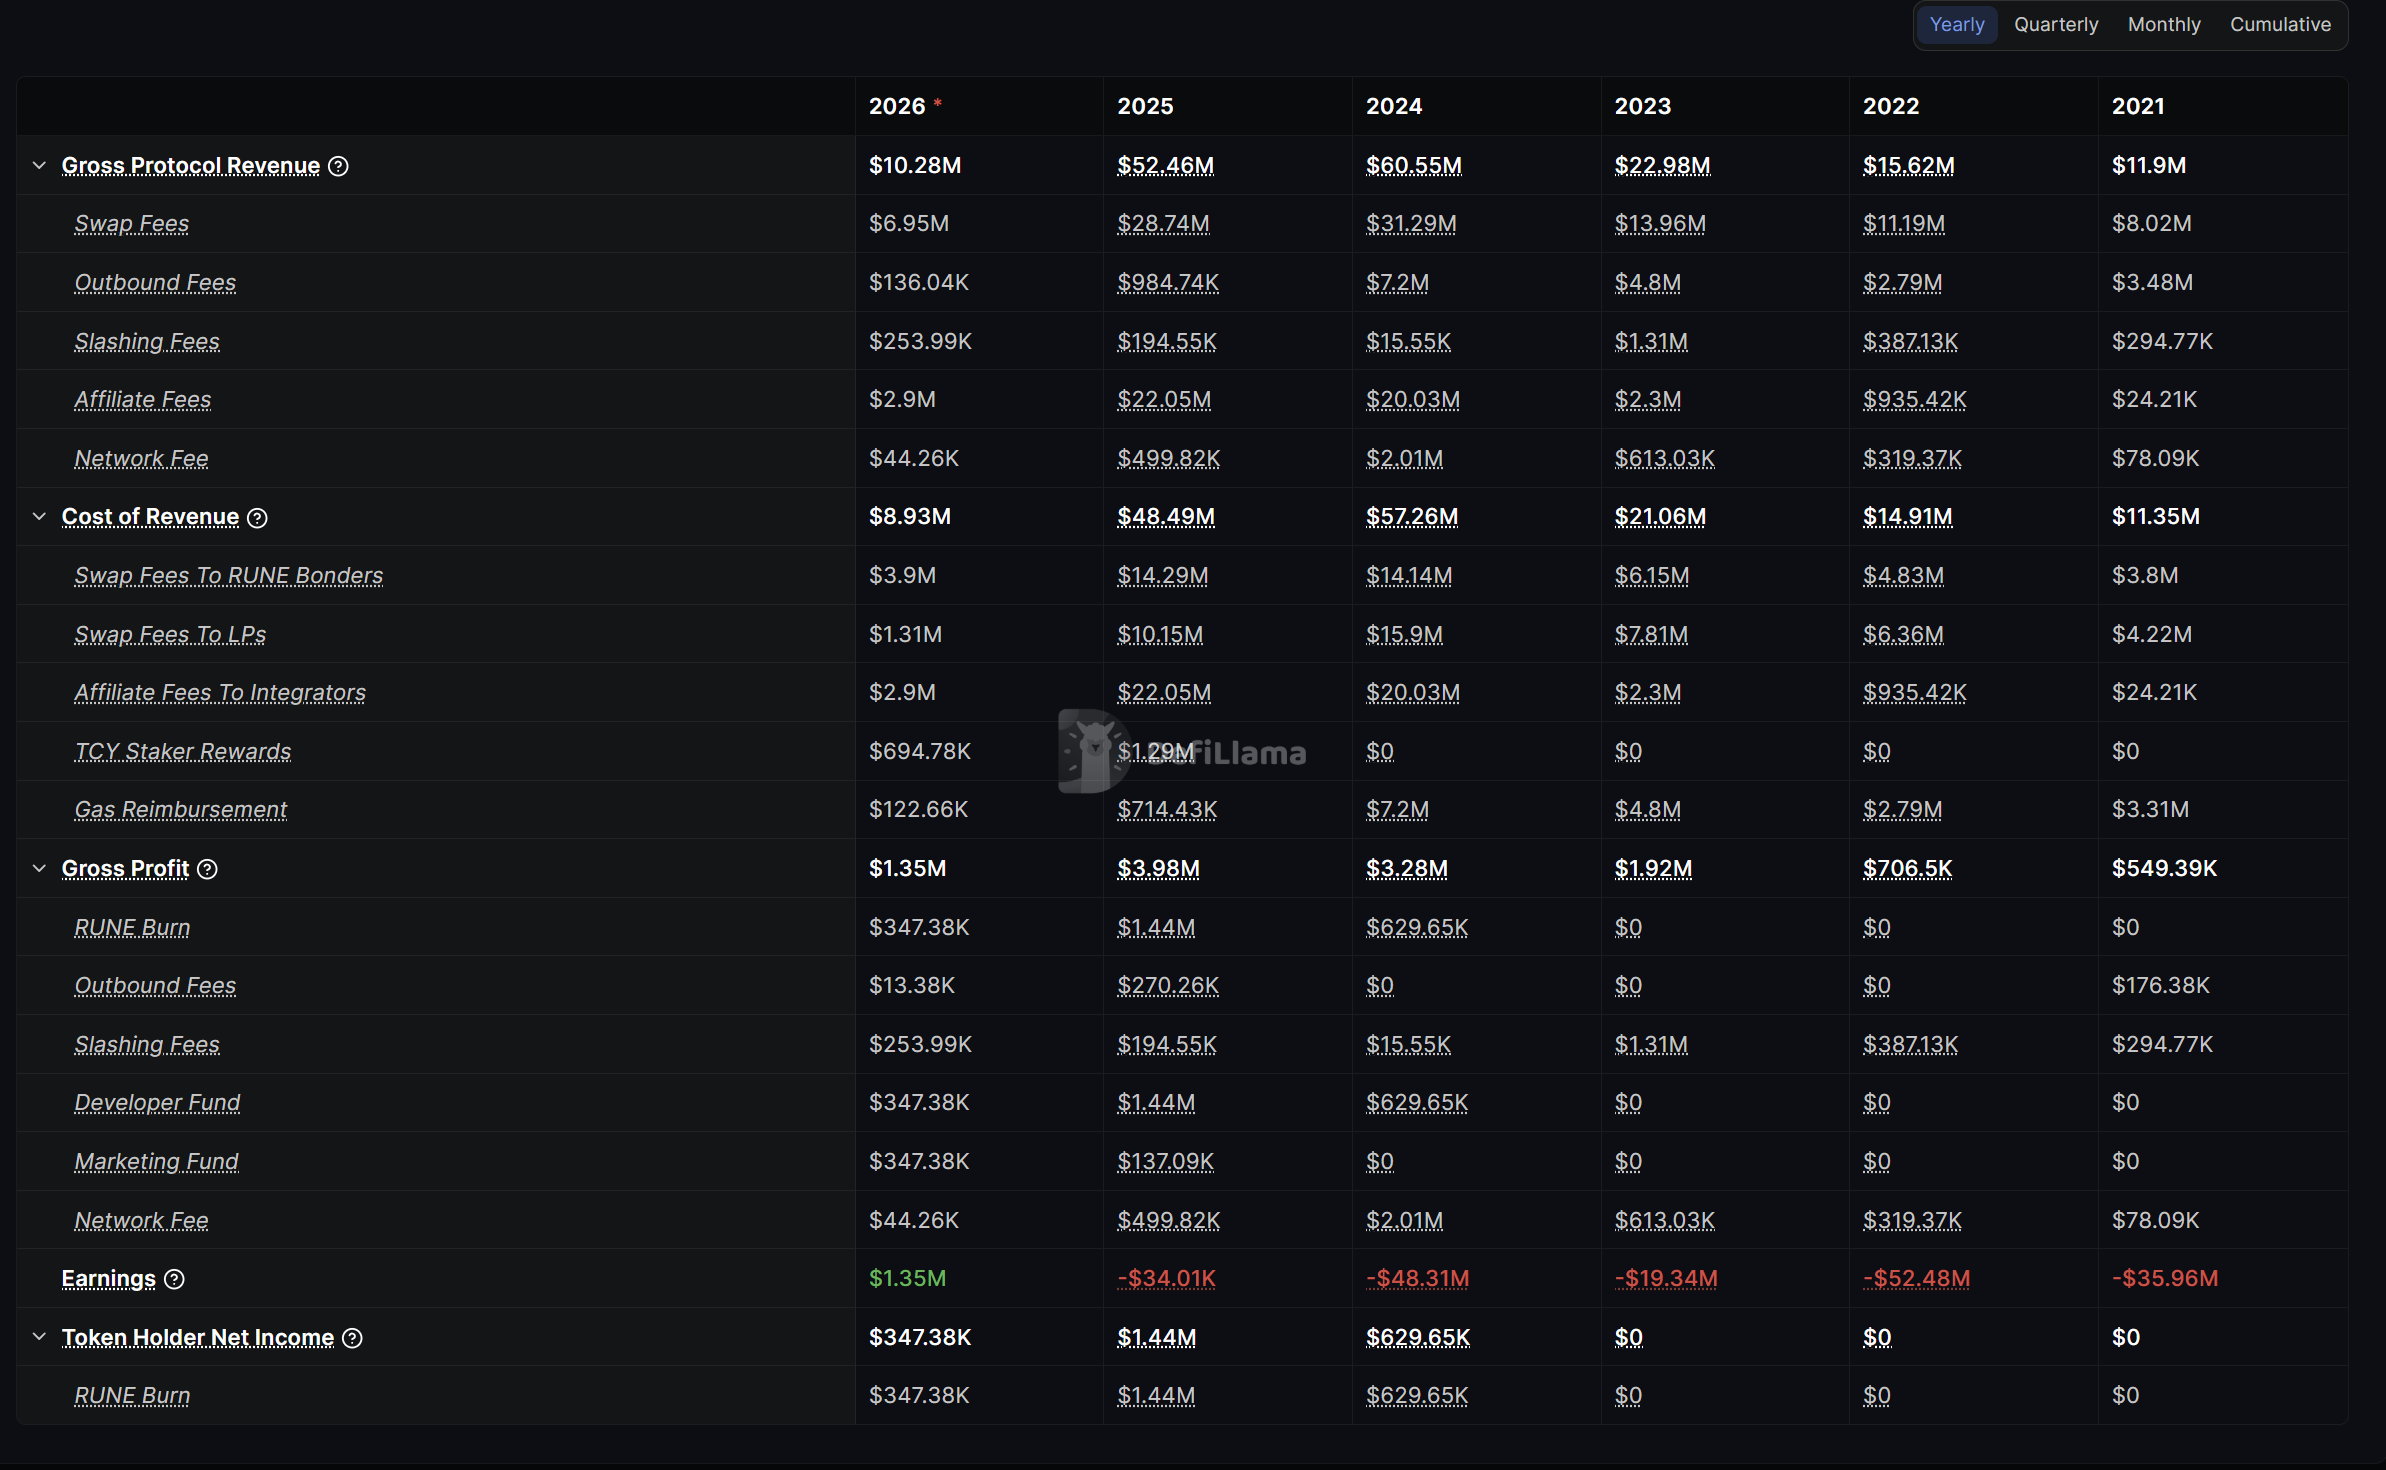
For a more detailed view, the dashboard also includes a full income statement showing where THORChain’s income comes from and how it is distributed. The income statement can be viewed on a monthly, quarterly, yearly, or cumulative basis, making it easy to compare performance across different periods or follow how the protocol’s financials have developed over time.
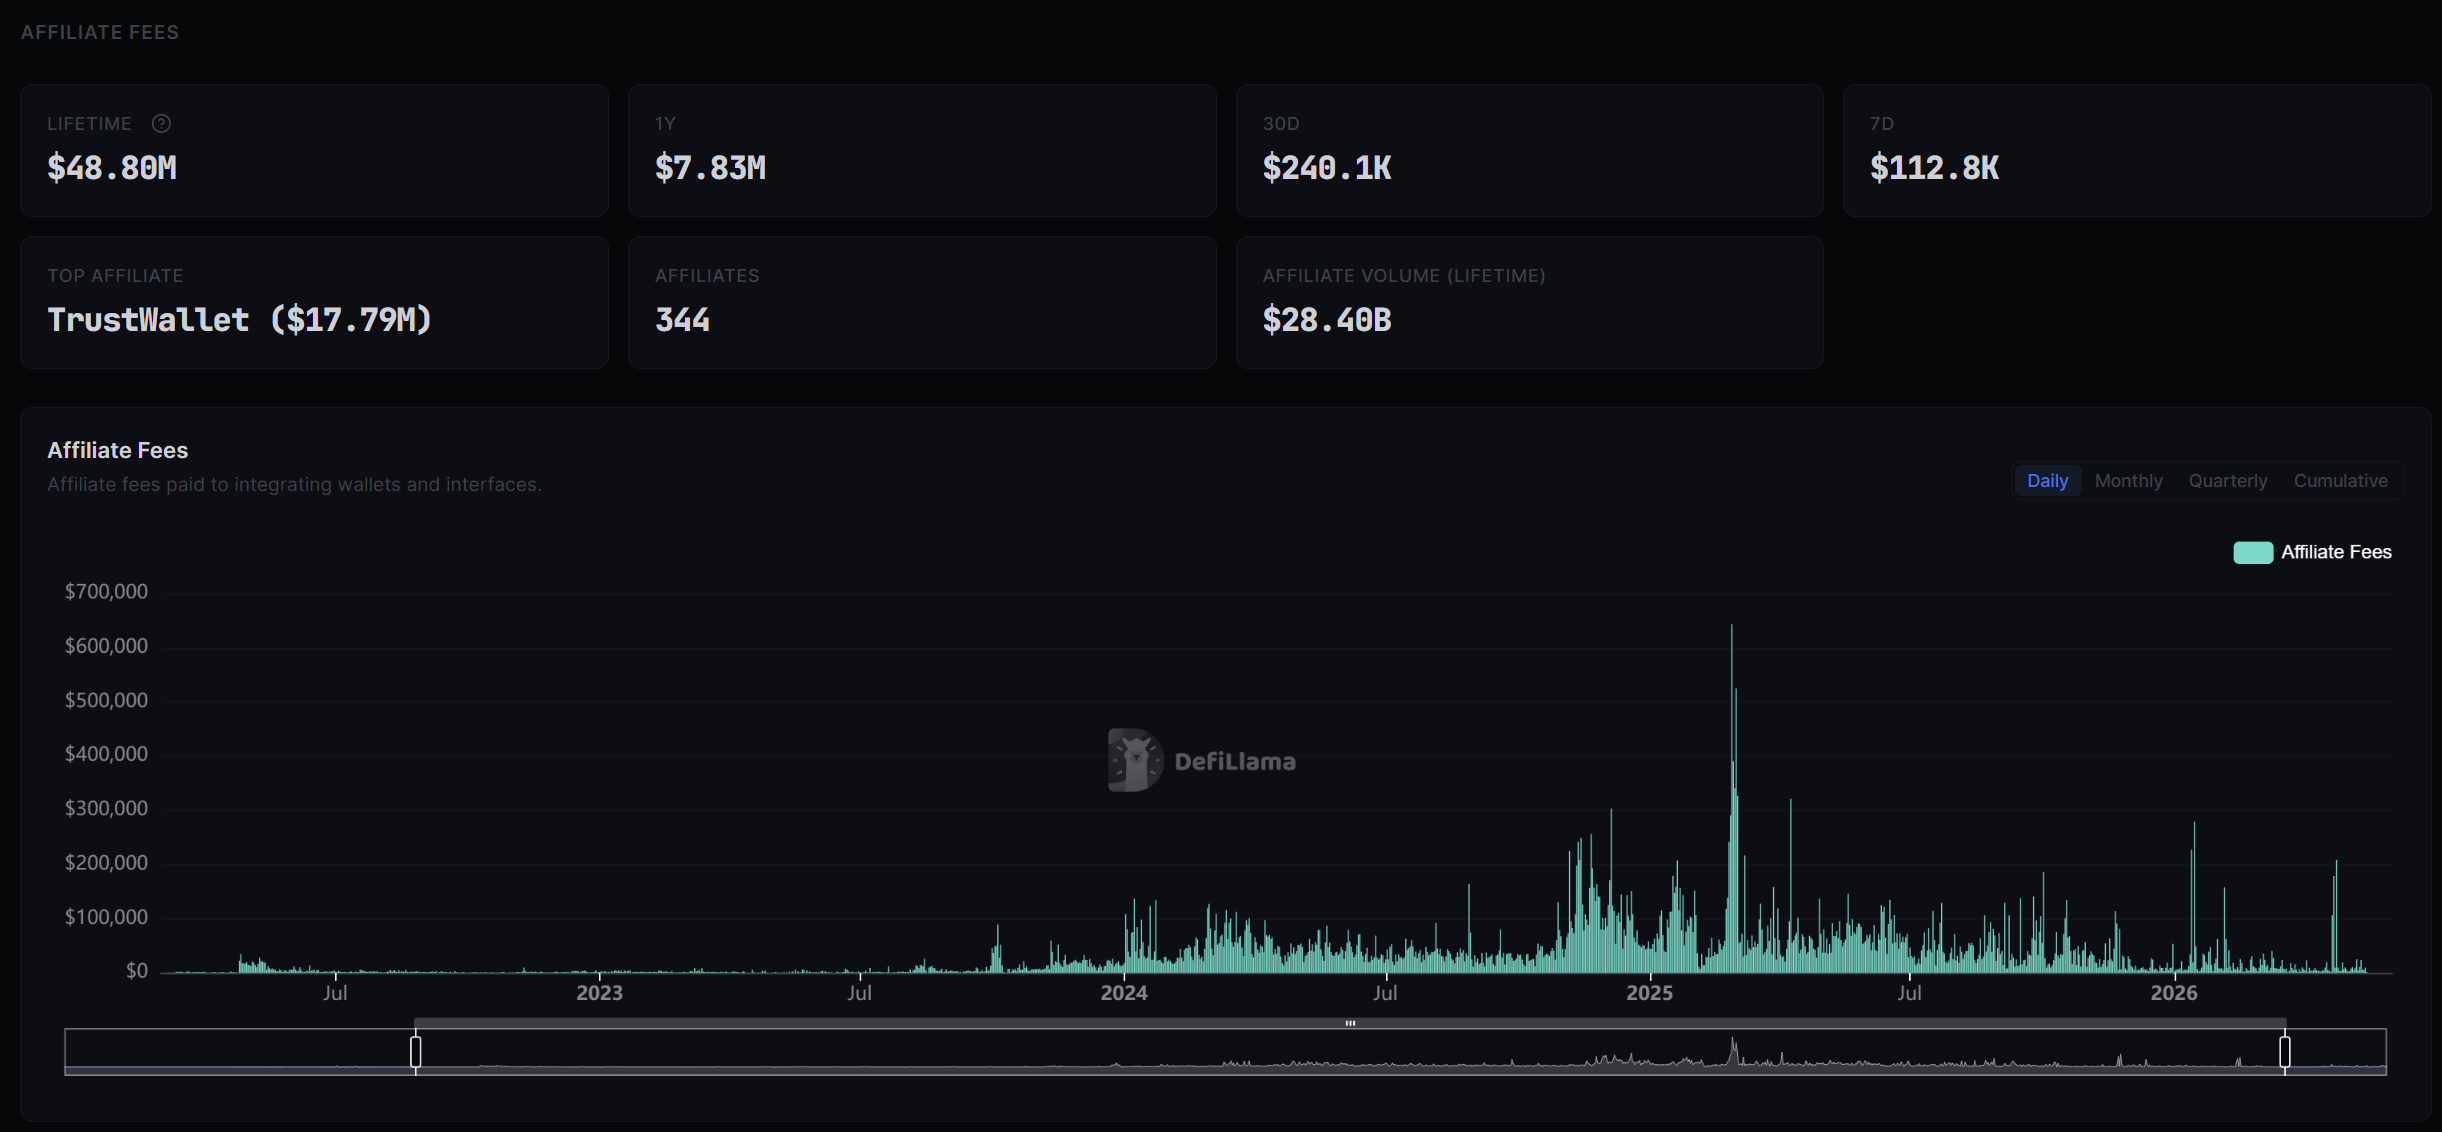
The financials page also provides a dedicated look at affiliate fees, showing how much wallets and interfaces have earned by routing swaps through THORChain. Users can see lifetime and recent affiliate fees, total routed volume, and a leaderboard of individual integrations.
Track THORChain’s Trading Activity
The next page of the dashboard focuses on activity across THORChain, giving users a clearer picture of how much the network is being used and where that activity is coming from.
At the top, users can see lifetime and 30-day swap volume, as well as average daily volume over the past 30 days.
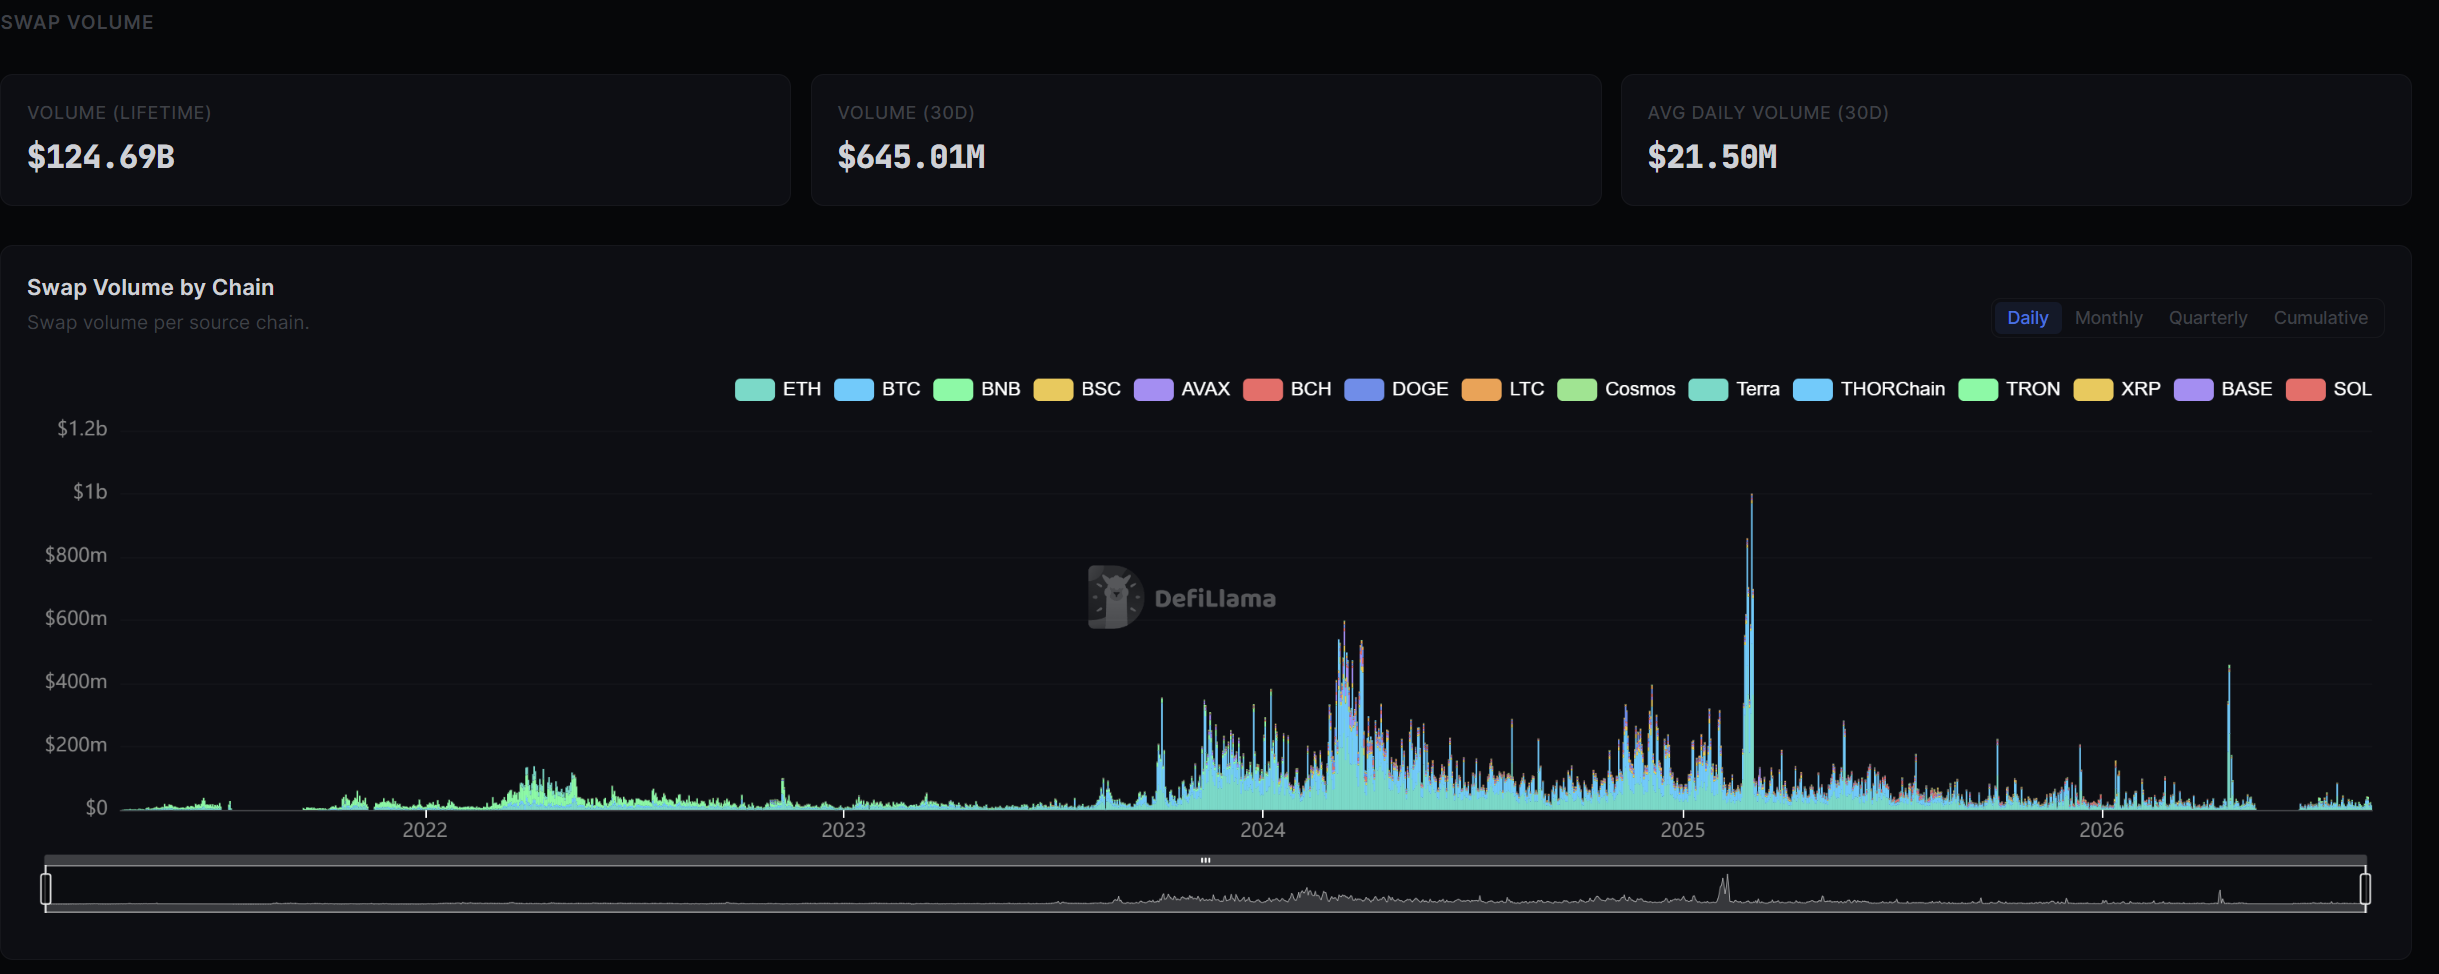
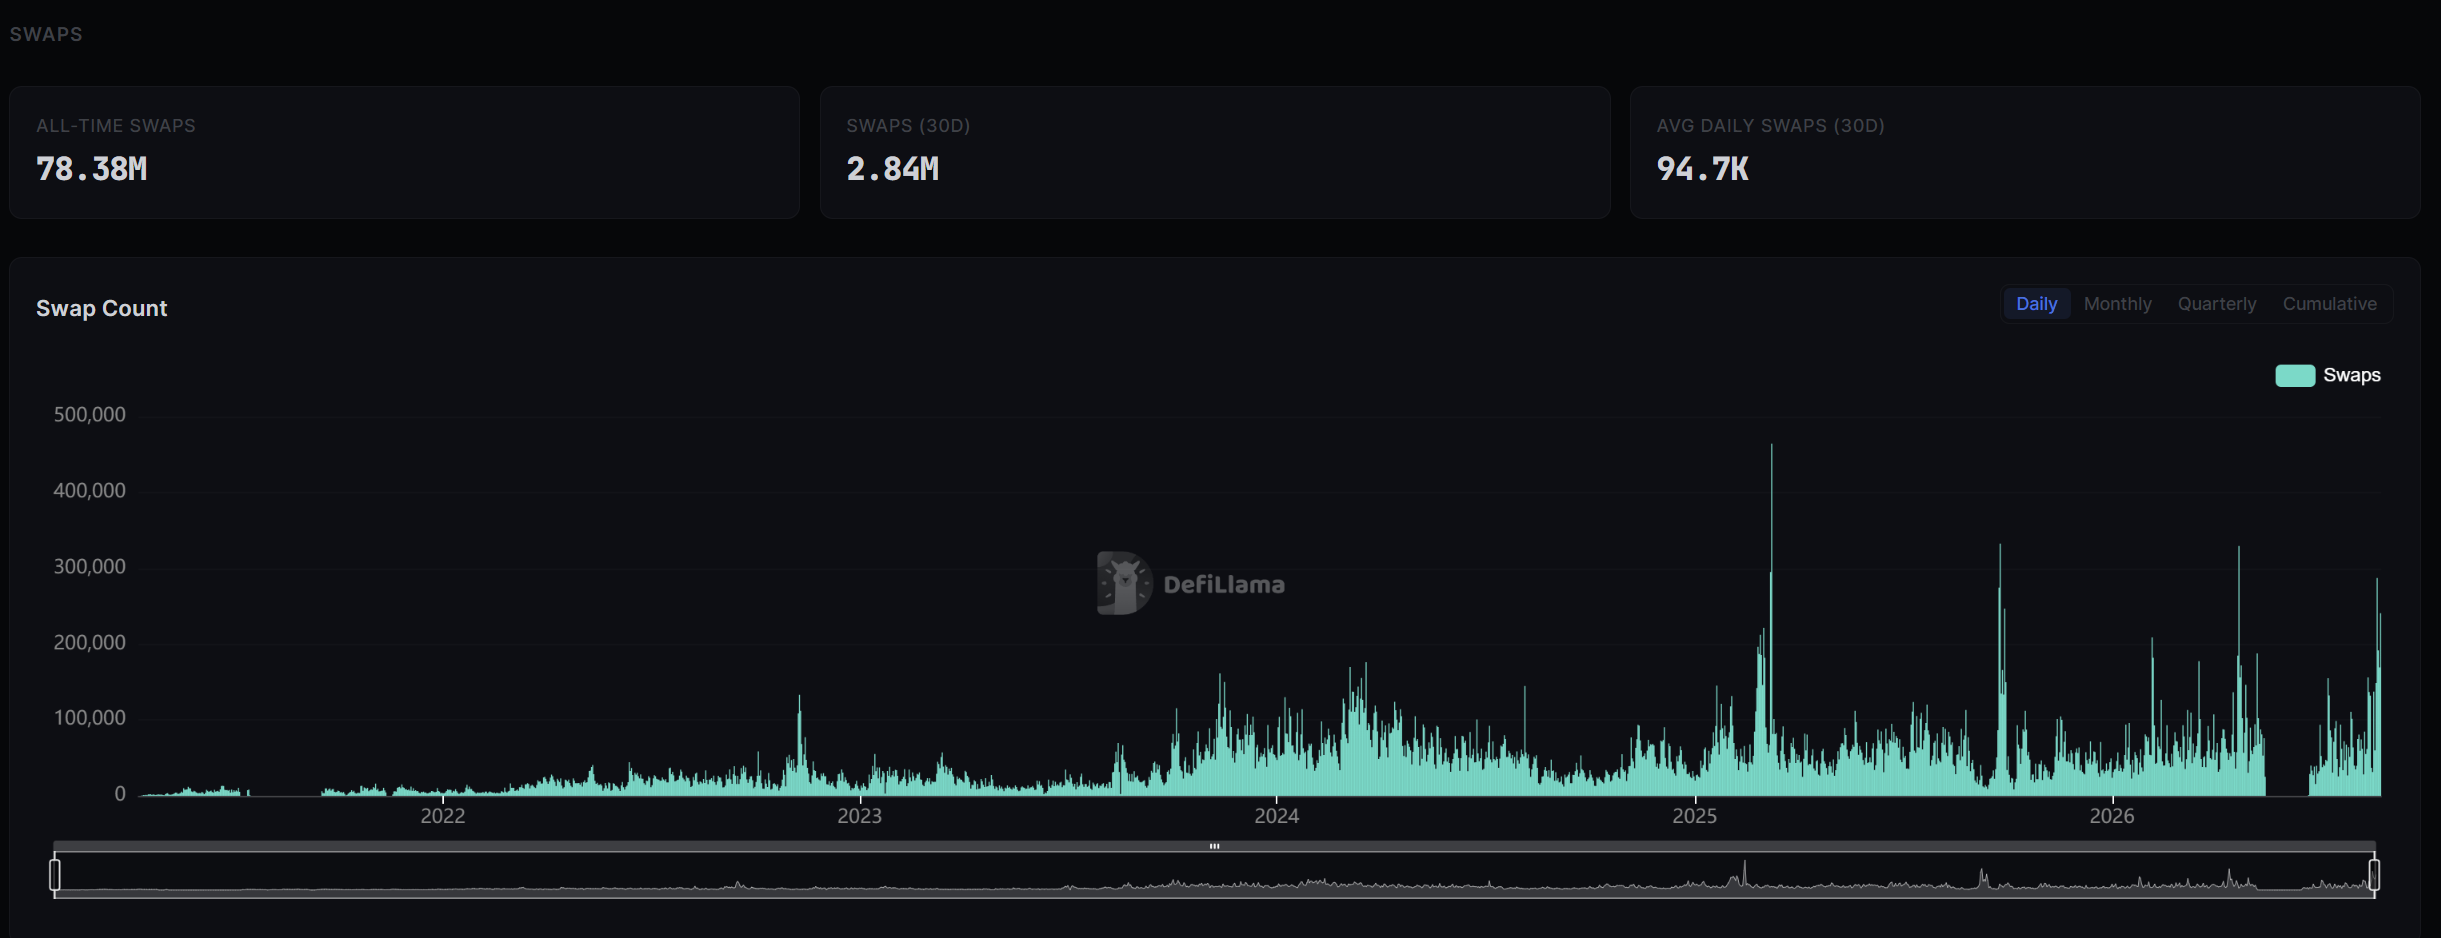
Users can also break swap volume down by source chain, making it possible to see which networks are contributing the most trading activity. Alongside volume, the dashboard tracks unique wallets and swap counts across different periods. This helps show whether changes in volume are being driven by more users, more frequent trading, or larger individual swaps.
The page also breaks activity down by swap type, separating Native Assets, Trade Assets, and Secured Assets. This gives users another way to understand what kinds of assets are driving activity on THORChain and how the composition of trading changes over time.
Track Network Security and Protocol-Owned Liquidity
The next page provides insight into both the capital securing THORChain and the liquidity owned by the protocol itself.
Users can see the number of active nodes and Node Operators, the current bonding APR, and how much RUNE is bonded to the network.
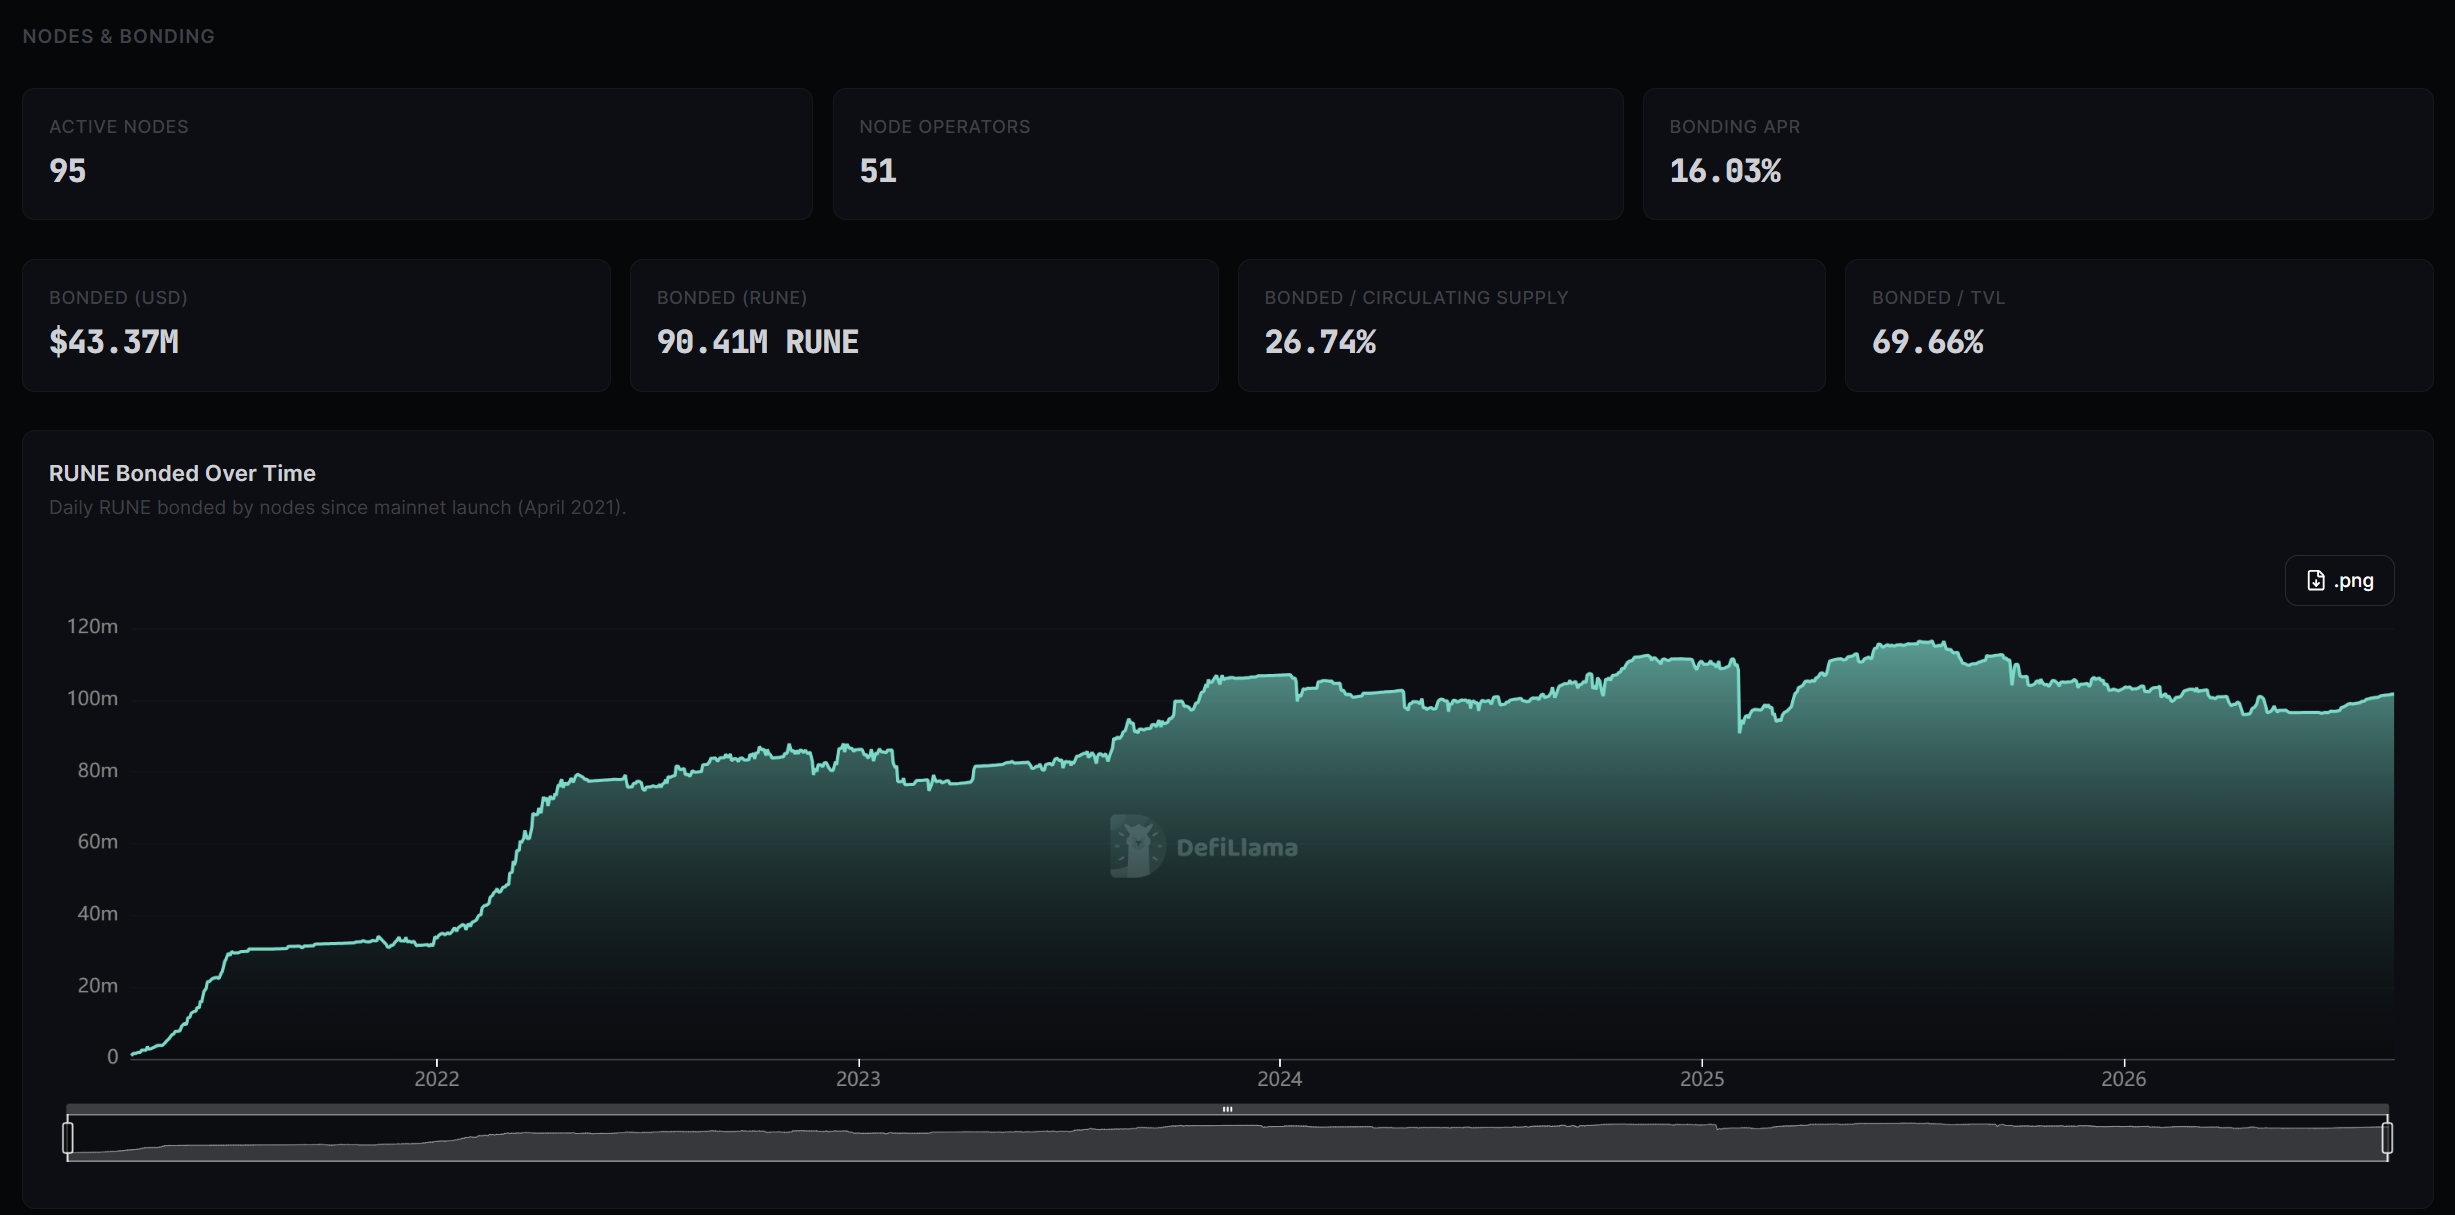
The dashboard also puts this bonded capital into context by showing it as a percentage of circulating RUNE supply and THORChain’s TVL. A historical chart tracks the amount of RUNE bonded over time, making it easier to see how the capital securing THORChain has changed since mainnet launched in April 2021.
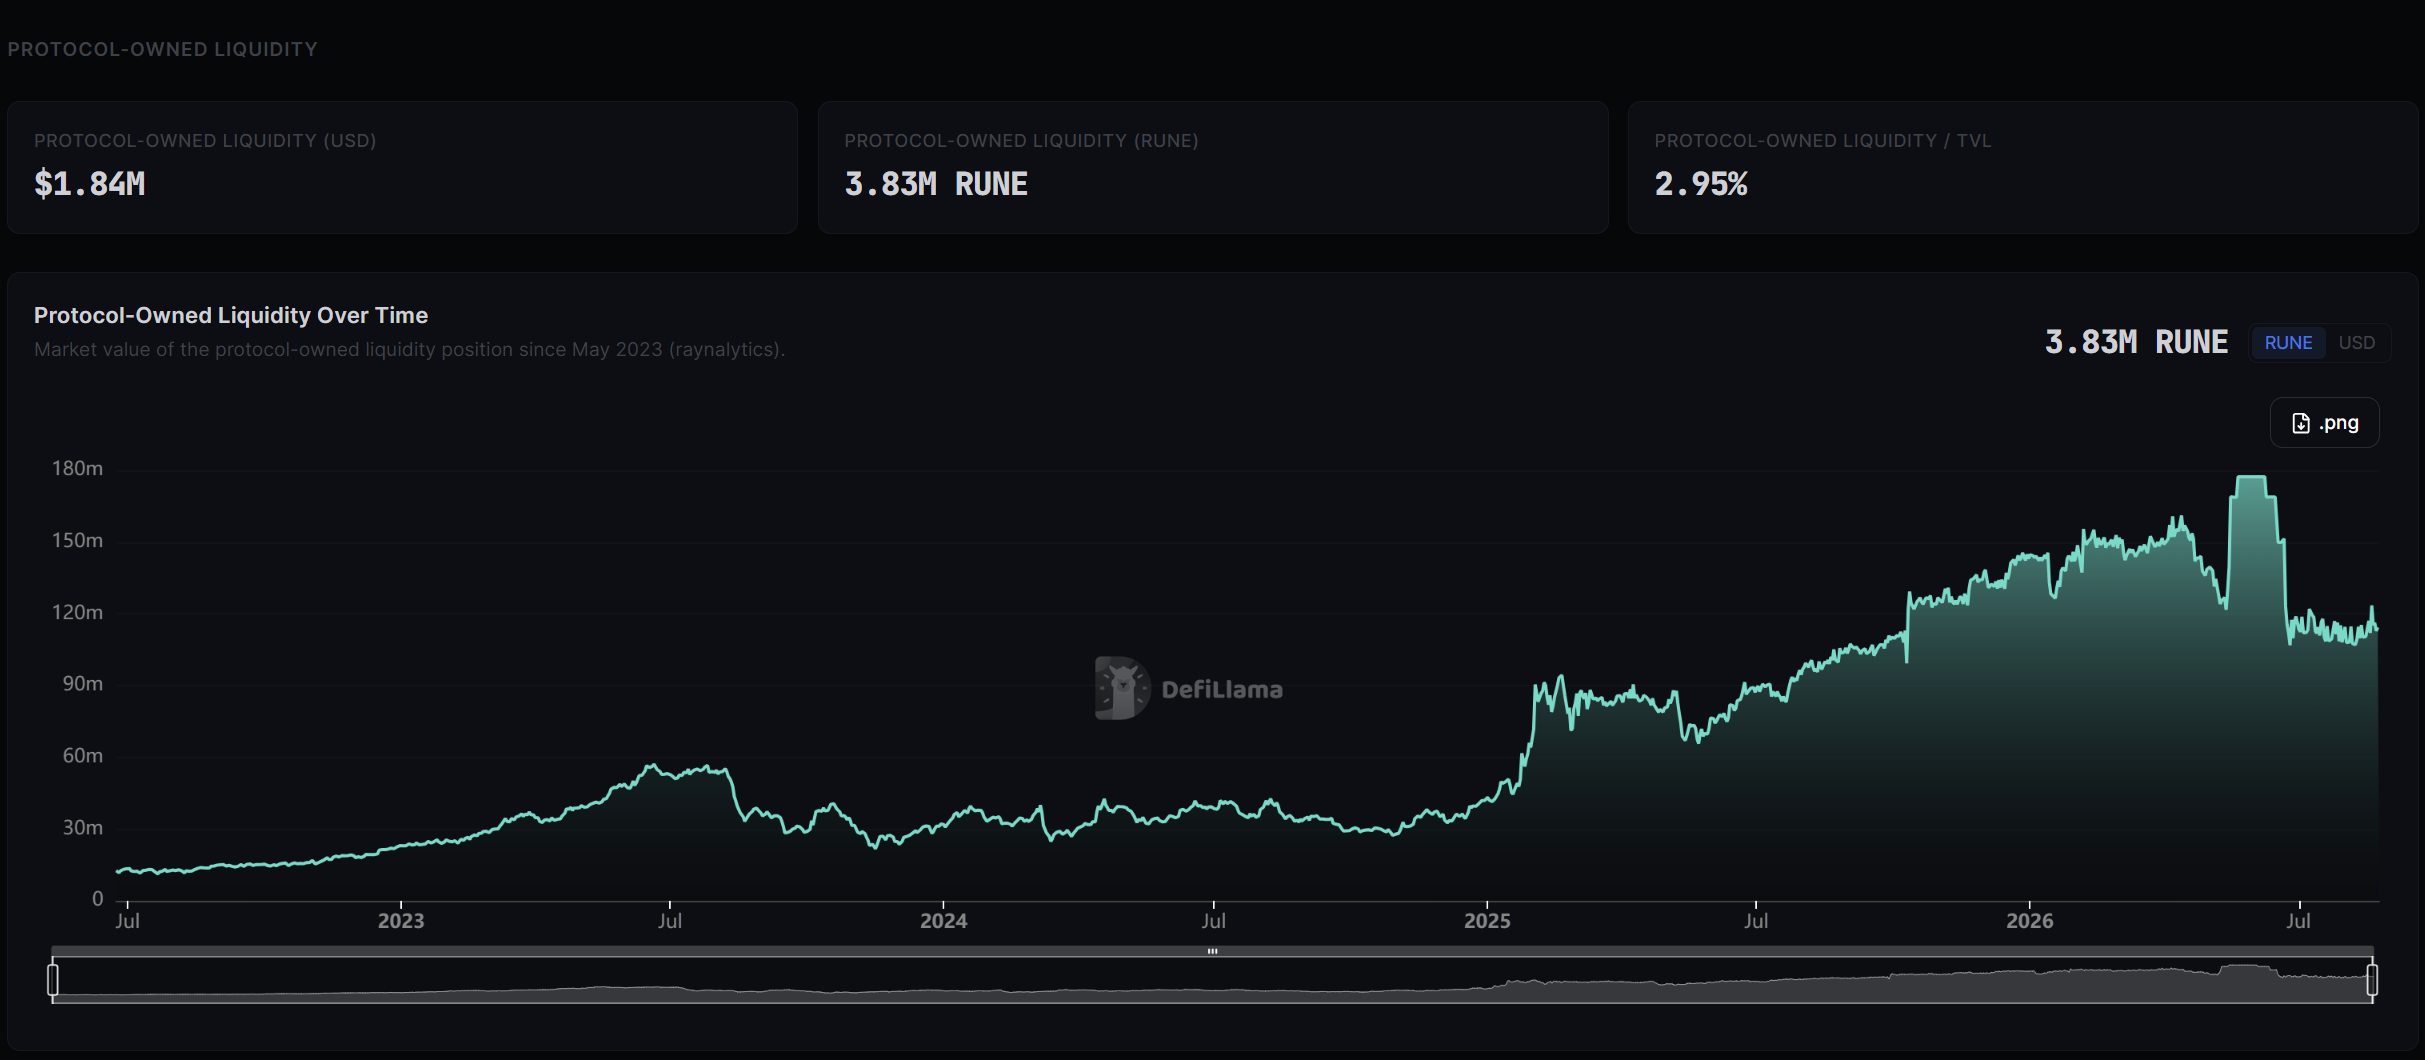
The same page also covers Protocol-Owned Liquidity, showing the value of THORChain’s POL position in both USD and RUNE, as well as its share of total TVL. Users can also track how the value of this position has changed over time, with historical data available from May 2023 onward.
Track THORChain’s Token Supply
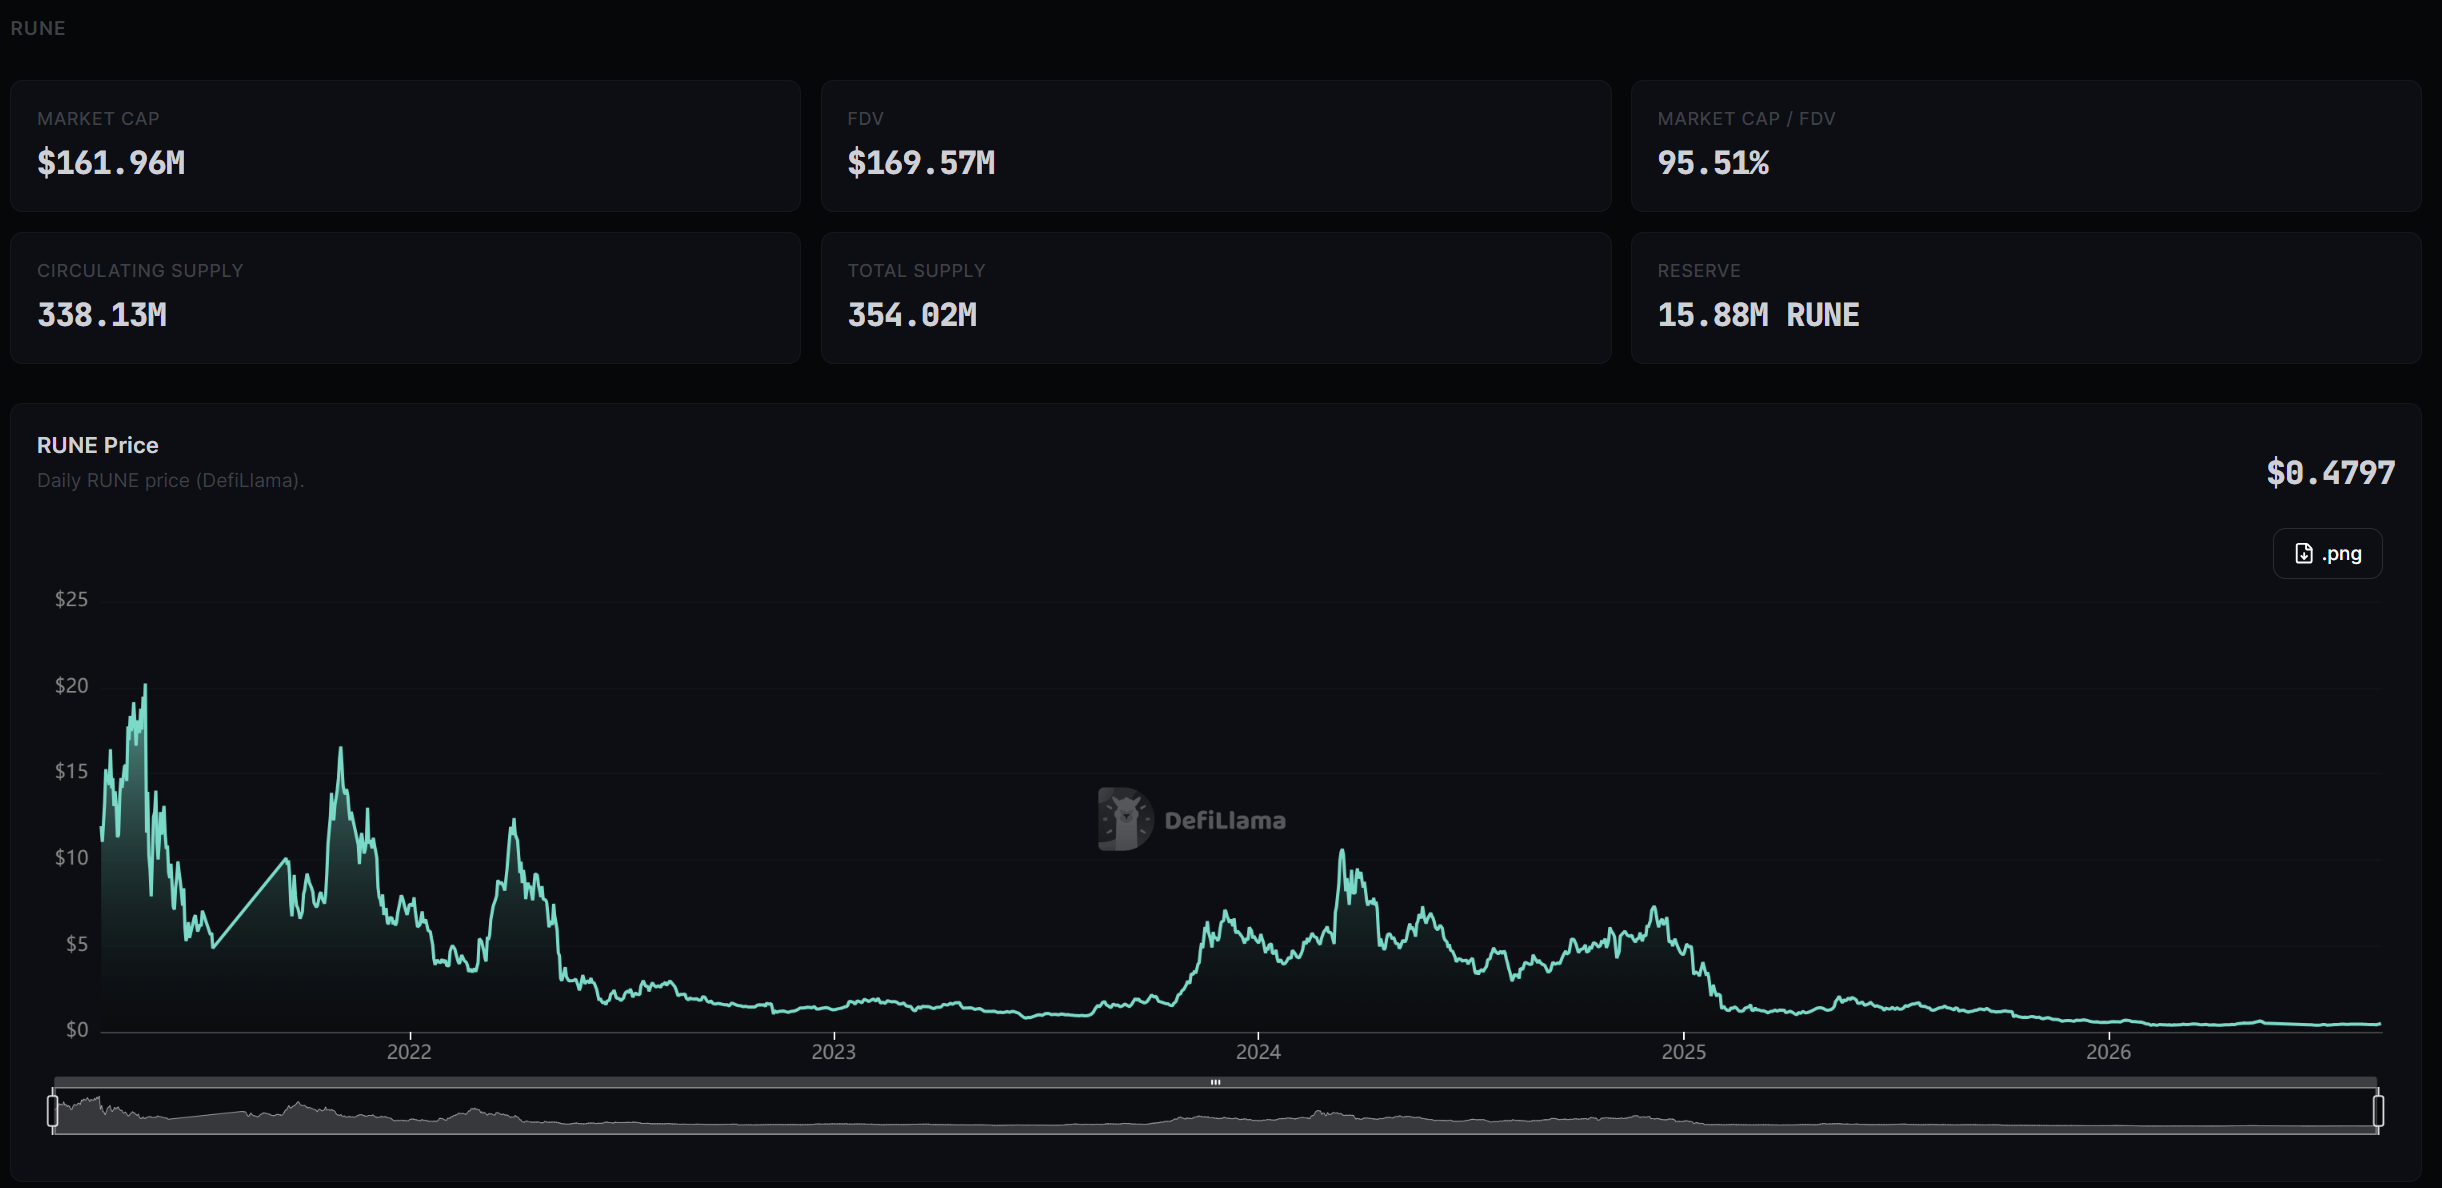
The next section of the dashboard focuses on THORChain’s two tokens, RUNE and TCY. For RUNE, users can see its market cap, fully diluted valuation, circulating and total supply, and the amount of RUNE held in the Reserve.
The dashboard also tracks RUNE’s price over time and compares it directly with THORChain’s swap volume, making it easier to see how changes in network activity line up with movements in the token.
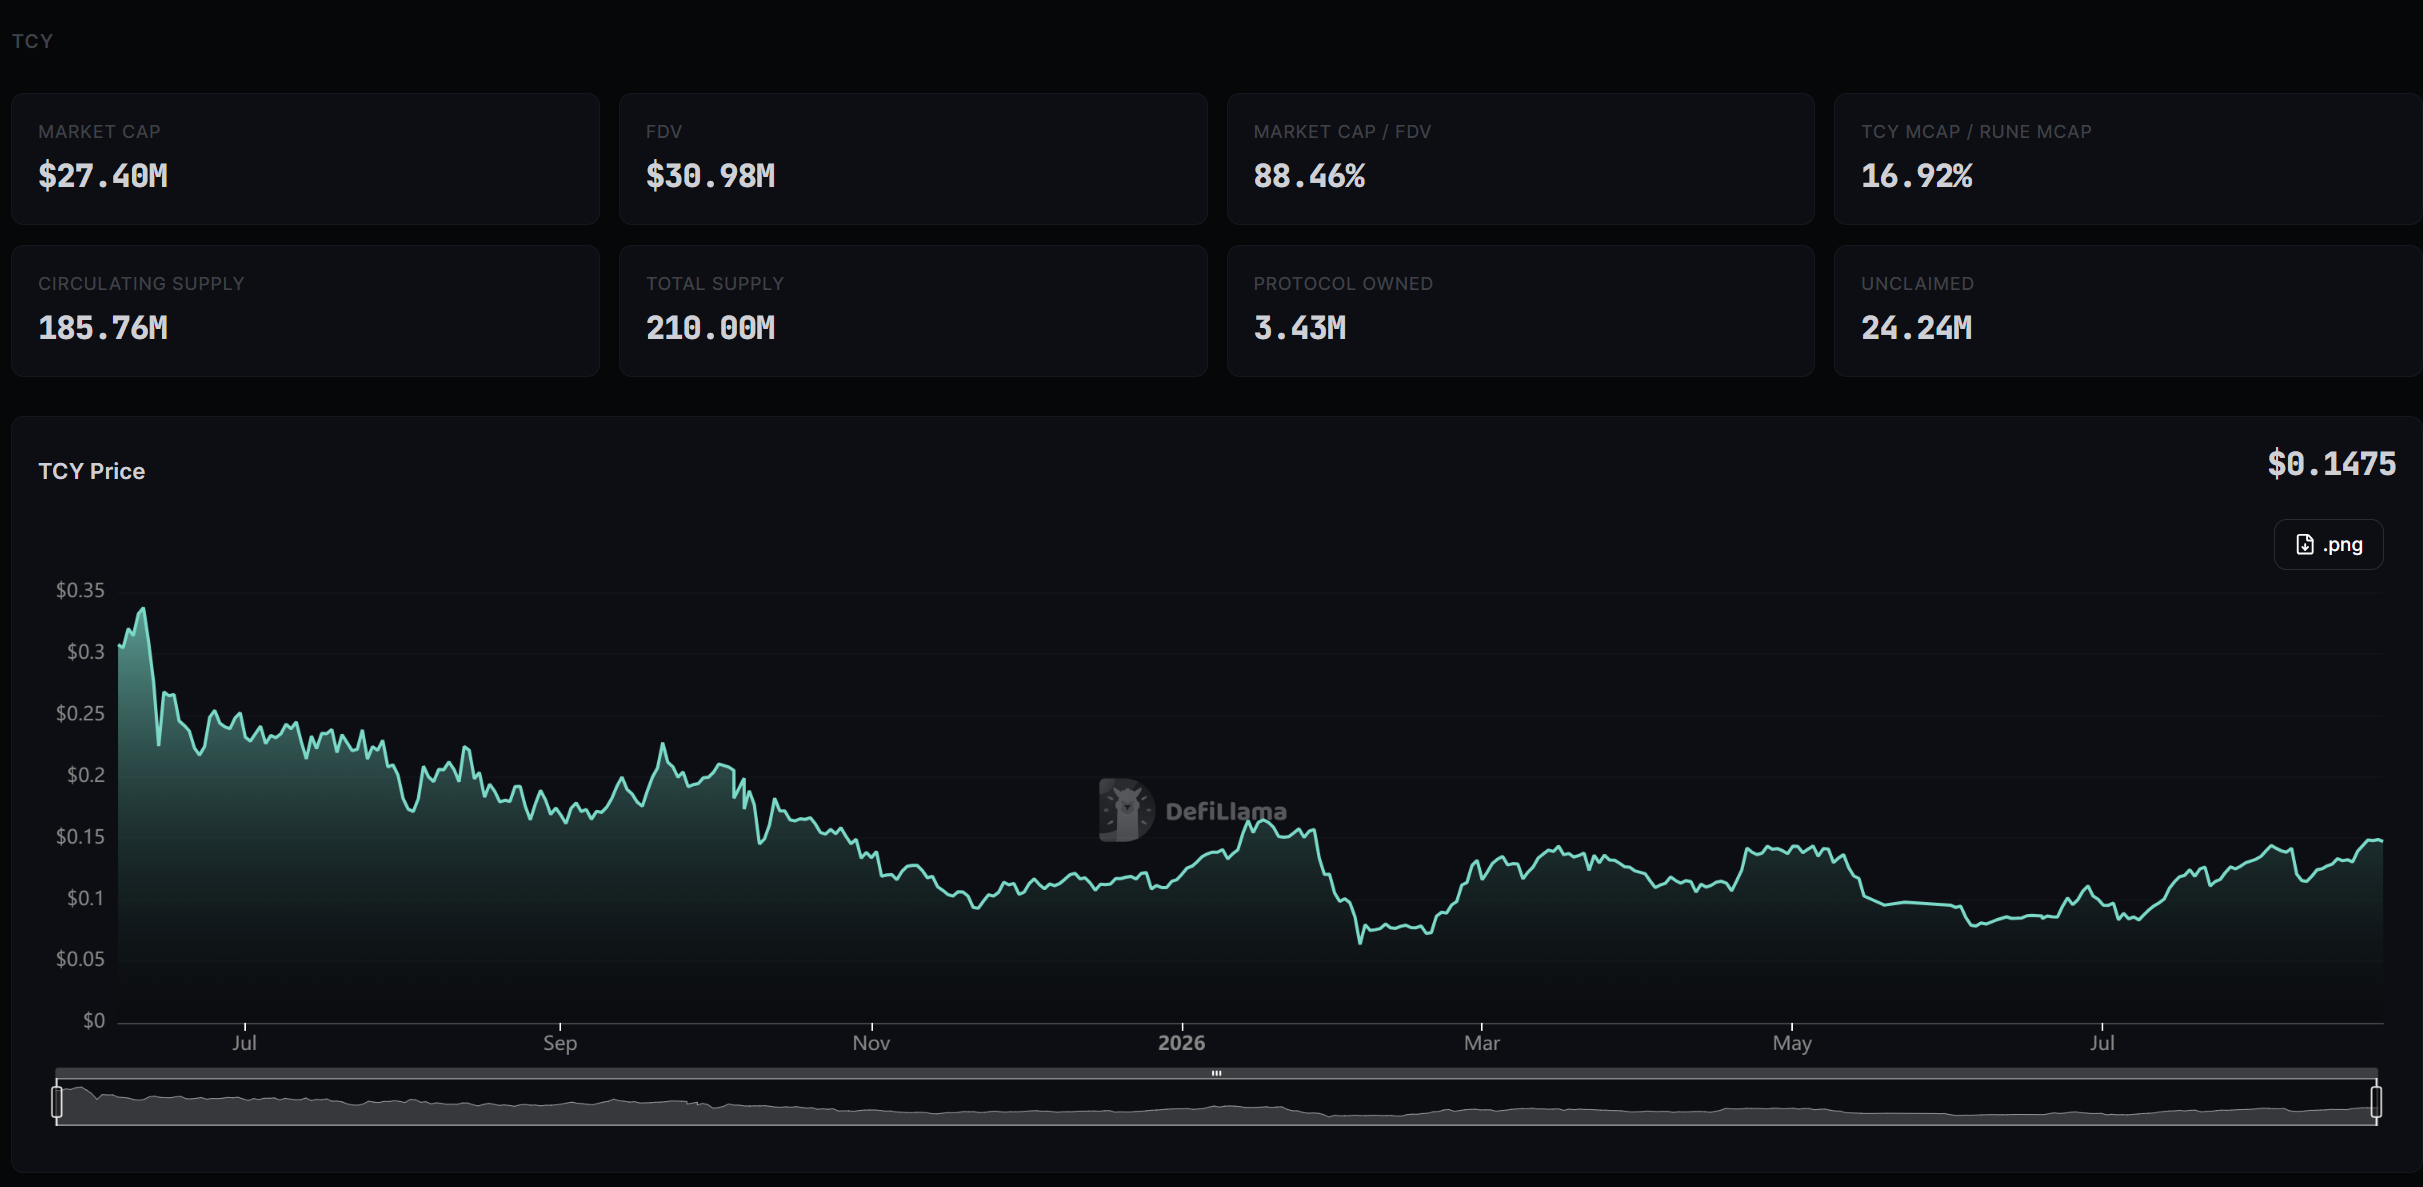
The TCY section provides a similar overview, including its market cap, circulating supply, total supply, and the amount held or unclaimed by the protocol. Users can also follow TCY’s price, staking APR, and the amount of protocol-owned TCY over time.
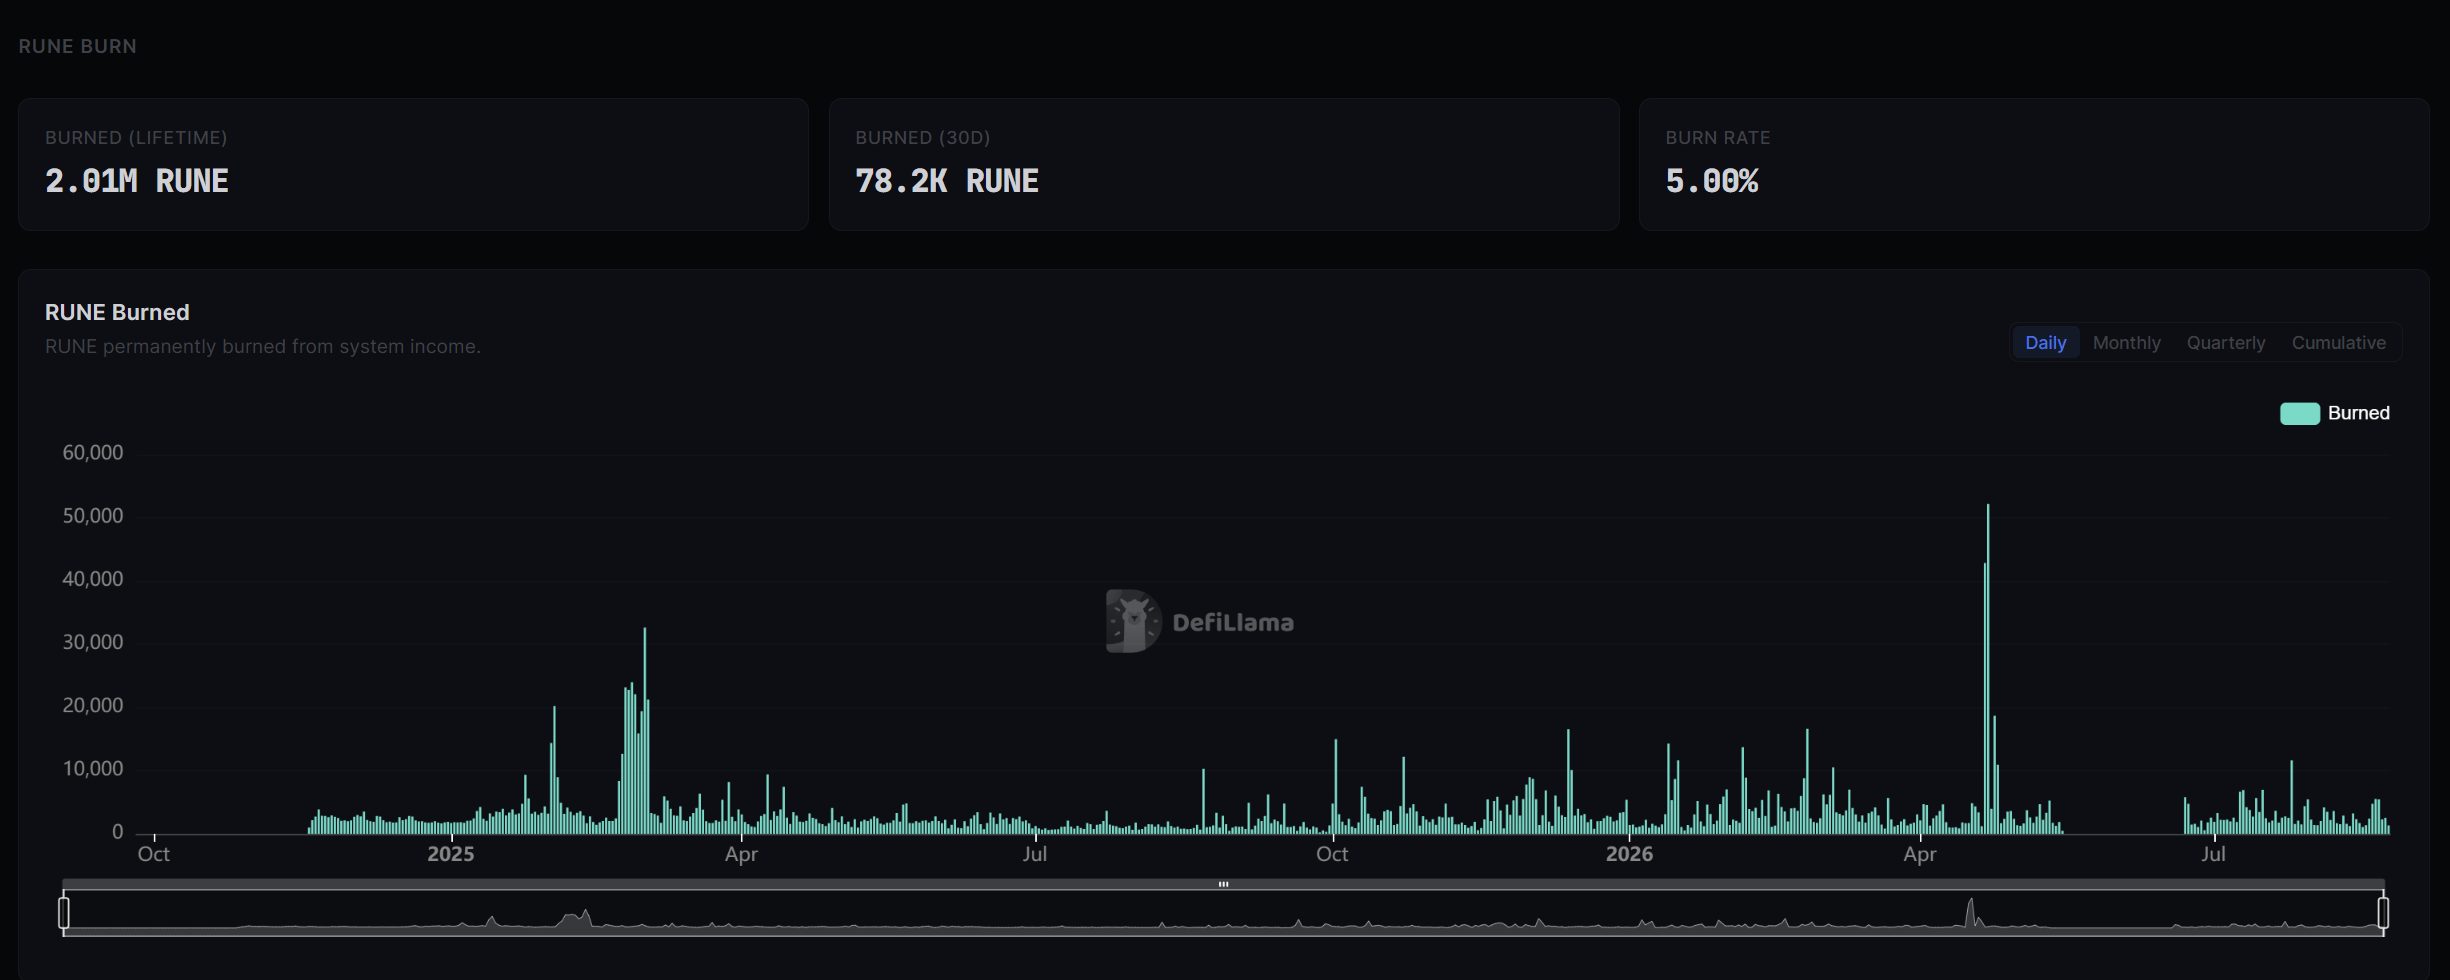
The dashboard also tracks the RUNE burn, showing how much RUNE has been permanently removed from circulation over time. Users can see both lifetime and recent burn figures, as well as the current burn rate, providing a simple way to follow how THORChain’s fee activity contributes to reducing the RUNE supply.
The following page covers RUNE token unlocks. Users can see how the token supply was originally allocated between insiders, the public sale, staking, the ecosystem, and the private sale, alongside a timeline of historical unlock events.
Since RUNE is now effectively fully unlocked, this section is particularly useful for understanding how the supply entered circulation over time and reviewing the token’s historical distribution rather than tracking a large future unlock schedule.
One Place to Follow THORChain’s Fundamentals
The DefiLlama Investor Relations dashboard gives anyone a much easier way to understand what is happening across THORChain without having to piece together data from multiple sources.
From financial performance and trading activity to bonding, Protocol-Owned Liquidity, RUNE, TCY, and token unlocks, the dashboard brings the most important metrics behind the network into one place and makes it possible to see how they develop over time.
More importantly, the data is tracked and presented by DefiLlama as an independent third party. This gives users, researchers, and investors a transparent way to follow THORChain’s fundamentals, understand where growth is coming from, and build a clearer picture of the health of the network.

Related articles
![Marketing Update Q2 2026]()
Aug. 18, 2026
Marketing Update Q2 2026
- Marketing
![]()
May. 7, 2026
Marketing Update: Feb - March 2026
- Marketing
![]()
Feb. 27, 2026
New THORChain Logos
- Marketing
![]()
Feb. 18, 2026
Marketing Update: January 2026
- Marketing
![]()
Jan. 18, 2026
Nov- Dec Marketing Update
- Marketing
![]()
Dec. 11, 2025
Introducing the THORChain Native Swap Interface
- Marketing